Télécharger la présentation
La présentation est en train de télécharger. S'il vous plaît, attendez

1
Le mouvement des « villes en transition »
…une petite excursion chez un mouvement citoyen d’esprit positif ou … comment organiser dans la bonne humeur le déclin de pétrole à venir Bertrand Vanbelle// Jean-Philippe Mommart // mars 2013 – EcoloJ

2
Plan Le contexte Changement Climatique - Pic Pétrolier – crise économique et sociale Descente énergétique Vision positive et résilience Les ingrédients de la transition Inclusion, transition intérieure, permaculture, … Les initiatives de transition En Belgique et dans le monde Le cas d’Ixelles en Transition

4
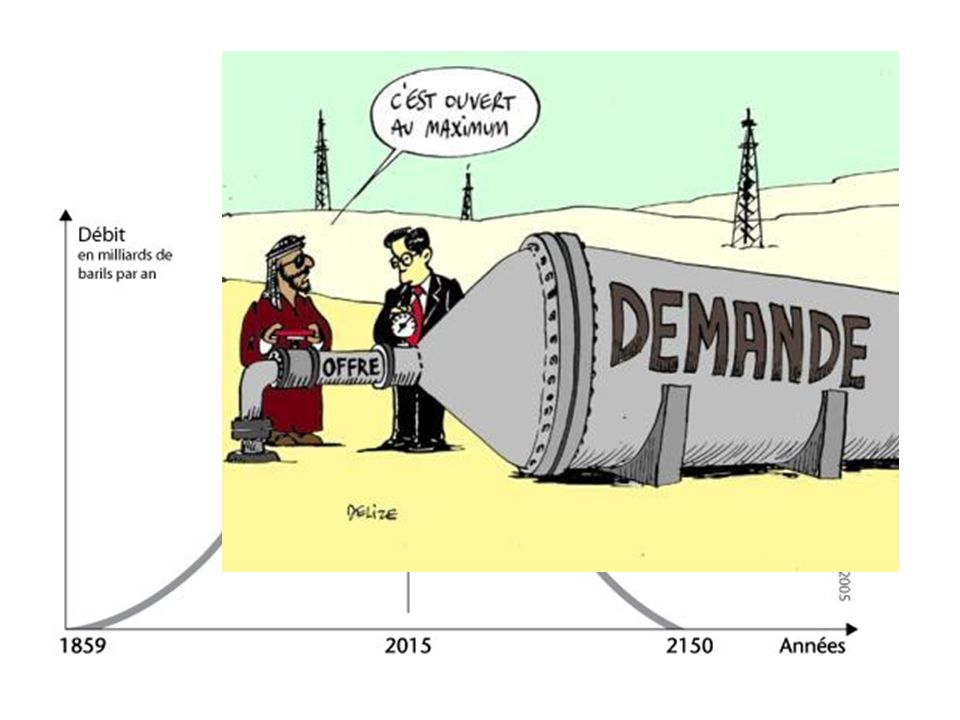
Découverte et production globale de pétrole

5
Pic de ... TOUT ! CHONPS : Pablo Fossiles non renouvelables
RESSOURCES* Terbium (12 ans) Palladium (15 ans) Or, Zinc (17 ans) Plomb (22 ans) Cuivre (31 ans) Fer (79 ans) * au rythme actuel d’extraction CHONPS : Pablo
 Palladium (15 ans) Or, Zinc (17 ans) Plomb (22 ans) Cuivre (31 ans) Fer (79 ans) * au rythme actuel d’extraction. CHONPS : Pablo.")
6
Notre dépendance au pétrole dans tous les secteurs de l’économie

7
Changement climatique – la fin du débat
L'augmentation des températures moyennes depuis 60 ans est très probablement (niveau de certitude > 90%) due à l'augmentation des concentrations de gaz à effet de serre d'origine humaine. The debate about climate change has shifted. It’s no longer “Are humans responsible?”. In many circles it’s turned to “How can we implement the IPCC recommendations?” But there’s another debate, recognising a little known aspect of the IPCC 4th (current at June 2008) Report. Here’s the situation. The IPCC is the highly qualified body convened by the UN to look at the published science on climate change and draw conclusions and recommendations. They took hundreds and hundreds of published, peer reviewed articles and synthesised their findings from these. In order for them to do this analysis, they stipulated a cut-off date for these articles. It was mid That’s four years ago. Muse on that… None of the science that has emerged in the ensuing four years has been included in the report. Not only that, but there was deliberate toning down of the report, particularly the Summary and Recommendations for Policy Makers. The two big omissions were feedback mechanisms and the reducing performance of the climate sinks and how they might affect the climate. The last four years has yielded masses of new information about both of these and how they interact and affect the climate. Feedback mechanisms first. There are two types of feedback mechanisms – amplifying and stabilising. The amplifying mechanisms accelerate and “amplify” the effects. Turns out there are around 20+ feedback mechanisms and most of them are amplifying. And that’s a problem. Take one example “Albedo”. The word means “white” and refers to the reflectiveness of the earth’s surface and how that determines how much heat is absorbed by the earth or reflected back into space. Ice is a good example. Ice reflects back 80% of heat, while the sea around it reflects about 20% absorbing the other 80%. As soon as you get an ice loss, the rate of heat absorption by the ocean increases, warming the water and increasing the ice melt. This reduces how much heat is reflected, increasing temperatures. It’s easy to see how this vicious cycle can cause dramatic effects. In 2007, when the Artic ice melt reduced the total area by 25% less than the previously recorded minimum, we began to see the potential for these feedbacks. And incidentally, that measurement doesn’t include the reducing thickness of the ice, estimated to be less than half it was in 1970’s. Thin ice breaks up much more easily than thick ice, and consequently melts much faster. Think of crushed ice in a glass versus large ice cubes. The latter lasts much longer. The next slide shows the dramatic ice melt, and brings up some of the limitations of the IPCC report. Initially, they suggested that the Arctic could be ice-free in summer by Current evidence is suggesting that this may well happen before Now the carbon sinks. Up until recently, the oceans and the worlds forests were absorbing about 50% of our carbon emissions. However, as the concentrations of carbon dioxide have gone up, the ability of those sinks to absorb carbon is going down. This means that even if we start reducing our carbon emissions as a species, it may not mean that the carbon concentrations will go down as fast we might have hoped. Which brings us back to the IPCC report and their assertion that 2C increase above the pre-industrial period is safe. It doesn’t look like it is. We’ve increased global average temperatures by 0.8C since the start of the industrial revolution. In addition to that, because of the inertia in the climate systems, we’re already committed to another 0.6C, bring us close to 1.5C increase. If we’re already seeing the demise of the arctic ice at 0.8C, what are we going to see at 1.5C? And what would happen at the “safe” limit of 2C? Incidentally, there’s no sea level rise as the Arctic ice melts because it’s seaborne ice (like the ice in that gin and tonic). However, as those sea temperatures go up, we’ll see an accelerating melt on Greenland (which is already showing dramatic acceleration through previously little-understood mechanisms such as water pooling on the surface, forming chimneys (“moulins”) that send millions of gallons down to the base of the glacier, melting the underside of the glacier and reducing the friction between it and the rock below, allowing it to move much faster towards the sea... There’s 7 metres of sea level rise if Greenland melts. So when you hear the governments talking about the IPCC recommendations, and establishing targets based on it, you need to understand that these will change, dramatically. The targets we must go for in terms of curtailing carbon emissions are massively more stringent than anyone is talking about right now. Be prepared... Upsala Glacier, Argentina 7
 due à l augmentation des concentrations de gaz à effet de serre d origine humaine. The debate about climate change has shifted. It’s no longer Are humans responsible . In many circles it’s turned to How can we implement the IPCC recommendations But there’s another debate, recognising a little known aspect of the IPCC 4th (current at June 2008) Report. Here’s the situation. The IPCC is the highly qualified body convened by the UN to look at the published science on climate change and draw conclusions and recommendations. They took hundreds and hundreds of published, peer reviewed articles and synthesised their findings from these. In order for them to do this analysis, they stipulated a cut-off date for these articles. It was mid That’s four years ago. Muse on that… None of the science that has emerged in the ensuing four years has been included in the report. Not only that, but there was deliberate toning down of the report, particularly the Summary and Recommendations for Policy Makers. The two big omissions were feedback mechanisms and the reducing performance of the climate sinks and how they might affect the climate. The last four years has yielded masses of new information about both of these and how they interact and affect the climate. Feedback mechanisms first. There are two types of feedback mechanisms – amplifying and stabilising. The amplifying mechanisms accelerate and amplify the effects. Turns out there are around 20+ feedback mechanisms and most of them are amplifying. And that’s a problem. Take one example Albedo . The word means white and refers to the reflectiveness of the earth’s surface and how that determines how much heat is absorbed by the earth or reflected back into space. Ice is a good example. Ice reflects back 80% of heat, while the sea around it reflects about 20% absorbing the other 80%. As soon as you get an ice loss, the rate of heat absorption by the ocean increases, warming the water and increasing the ice melt. This reduces how much heat is reflected, increasing temperatures. It’s easy to see how this vicious cycle can cause dramatic effects. In 2007, when the Artic ice melt reduced the total area by 25% less than the previously recorded minimum, we began to see the potential for these feedbacks. And incidentally, that measurement doesn’t include the reducing thickness of the ice, estimated to be less than half it was in 1970’s. Thin ice breaks up much more easily than thick ice, and consequently melts much faster. Think of crushed ice in a glass versus large ice cubes. The latter lasts much longer. The next slide shows the dramatic ice melt, and brings up some of the limitations of the IPCC report. Initially, they suggested that the Arctic could be ice-free in summer by Current evidence is suggesting that this may well happen before Now the carbon sinks. Up until recently, the oceans and the worlds forests were absorbing about 50% of our carbon emissions. However, as the concentrations of carbon dioxide have gone up, the ability of those sinks to absorb carbon is going down. This means that even if we start reducing our carbon emissions as a species, it may not mean that the carbon concentrations will go down as fast we might have hoped. Which brings us back to the IPCC report and their assertion that 2C increase above the pre-industrial period is safe. It doesn’t look like it is. We’ve increased global average temperatures by 0.8C since the start of the industrial revolution. In addition to that, because of the inertia in the climate systems, we’re already committed to another 0.6C, bring us close to 1.5C increase. If we’re already seeing the demise of the arctic ice at 0.8C, what are we going to see at 1.5C And what would happen at the safe limit of 2C Incidentally, there’s no sea level rise as the Arctic ice melts because it’s seaborne ice (like the ice in that gin and tonic). However, as those sea temperatures go up, we’ll see an accelerating melt on Greenland (which is already showing dramatic acceleration through previously little-understood mechanisms such as water pooling on the surface, forming chimneys ( moulins ) that send millions of gallons down to the base of the glacier, melting the underside of the glacier and reducing the friction between it and the rock below, allowing it to move much faster towards the sea... There’s 7 metres of sea level rise if Greenland melts. So when you hear the governments talking about the IPCC recommendations, and establishing targets based on it, you need to understand that these will change, dramatically. The targets we must go for in terms of curtailing carbon emissions are massively more stringent than anyone is talking about right now. Be prepared... Upsala Glacier, Argentina. 7.")
8
2006 et 2007 : GIEC et Al Gore 2006 : rapport Stern
This graph shows what may be one of the most obvious feedback mechanisms kicking in – “Albedo”. Summer 2007 saw a dramatic reduction in the sea ice in the Arctic. It was smaller by 25% than the previous minimum record and way way lower than the IPCC worst case estimates. It’s also looking at the overall area and doesn’t look at the thickness of the ice, which appears to have lost 50% of its thickness since 2001. In June 2010, scientists were predicting that this year would be a record breaker in all the wrong ways... 8

9
Now certain governments and agencies focus on either climate change or peak oil – eg the Hirsch report done for the US government in 2005 that focus on the risk implications of peak oil and, amid it’s very alarming conclusions, called for coal-to-liquids, a “drill, baby, drill” exploration policy and biofuels. Also the Stern report in the UK (2007) that took an economists view of climate change and called for climate engineering, nuclear, offsetting, carbon capture and storage, emissions trading. Again, the US DoD report in 2010 focuses primarily on energy security and warns of supply crunches in 2012 and massive shortages in 2015. None of these take a look at energy and climate together. Nor do they look adequately at the economic crisis and weave that into the picture, an essential component because it could well be that credit scarcity will accelerate the decline of available energy, both in terms of exploiting oil and building out of renewables infrastructure. This graphic explains that if you put peak oil and climate change together, you get a wholly different set of imperatives – first of all the need to plan for something other than “business as usual”. Second, a need to figure out how to power down the key systems of food, energy, transport and economics. Third, we’ll have to power up renewables. If we were to go a bit further and weave economic contraction into this picture, we’d see a higher level of urgency, we’d see perhaps a big question mark over some of the bigger renewables schemes. On the positive side, we’d perhaps see some very proactive plans (by the national or local governments) to set up the local infrastructure needed to support local economies – credit unions, local currencies, ownership models for local energy.
 to set up the local infrastructure needed to support local economies – credit unions, local currencies, ownership models for local energy.")
10
2007-2008 : Crise financière et sociale

11
Qu'est-ce qui nous bloque ?
Le mythe de la croissance Demain sera comme aujourd'hui, en plus grand et en plus lumineux. La croissance économique ne peut pas s’arrêter Les conditions de vie s'améliorent Le mythe du progrès. “La technologie résoudra tous nos problèmes.” “On n'arrête pas le progrès” La pensée unique : “There is no alternative” - “Le marché résoudra tout.“ ... If we know many of the solutions already, what’s stopping us all acting? There’s been a lot of work done on this. First of all, there are the dominant stories, or cultural myths, of our time, reinforced whenever we switch on the tv or look at a billboard. Each of us carries some of these myths with us day in, day out.

12
Plan Le contexte Changement Climatique - Pic Pétrolier – crise économique et sociale Descente énergétique Vision positive et résilience Les ingrédients de la transition Inclusion, transition intérieure, permaculture, … Les initiatives de transition En Belgique et dans le monde Le cas d’Ixelles en Transition

13
Quelles histoires pour le futur ?
Techno-fantaisie (Star Wars) Pic énergétique Gestion de la Terre Descente créative (Permaculture) Effondrement «Mad max» Stabilité «techno-écologique» Ascension industrielle Taking these cultural stories a little further, let’s look at the stories we tell ourselves about the future. This graph represents energy and resource use over time, from the point that agriculture was introduced 10,000 years ago to some time in the future, perhaps when our great grandchildren are alive. We can see the increase of energy use that accelerated dramatically during the industrial revolution. At some point we will hit “peak usable energy” possibly coinciding with peak oil, beyond which we need to be proactively working our way down the energy curve. There are a number of ways that might play out, featured on this graph. The first is the absurdly optimistic ‘techno-fantasy’ (e.g., unlimited nuclear cold fusion with no unforeseen negative impacts), flying cars and nutrition delivered to us in pills and strangely coloured liquids in tall glasses. This is the stuff of science fiction, and very entertaining it can be too. At the other end of the scale is a scenario like Mad Max but without any of the good bits. Many people are drawn to this scenario based on their perceptions of human nature and perhaps an overdeveloped sense of pioneer spirit. More realistic perhaps are the inter-mediate third and fourth scenarios. In ‘green-tech stability’ we essentially maintain our current level of energy usage by progressively moving to renewable sources such as wind, solar, tidal power, etc., as fossil fuel reserves are used up. Permaculture defines a fourth scenario termed ‘Earth Stewardship’, a ‘creative descent’ in which we progressively reduce our energy demands to return eventually to living within the natural energy and production budget of the land we occupy. Elements of all these scenarios can be found in the wide-ranging viewpoints and arguments of today’s ‘sustainability’ debates. Culture pré-industrielle Temps historique Agriculture av JC Révolution industrielle Baby Boom Nos petits-petits enfants... Temps
 Pic énergétique. Gestion de la Terre. Descente créative (Permaculture) Effondrement «Mad max» Stabilité «techno-écologique» Ascension industrielle. Taking these cultural stories a little further, let’s look at the stories we tell ourselves about the future. This graph represents energy and resource use over time, from the point that agriculture was introduced 10,000 years ago to some time in the future, perhaps when our great grandchildren are alive. We can see the increase of energy use that accelerated dramatically during the industrial revolution. At some point we will hit peak usable energy possibly coinciding with peak oil, beyond which we need to be proactively working our way down the energy curve. There are a number of ways that might play out, featured on this graph. The first is the absurdly optimistic ‘techno-fantasy’ (e.g., unlimited nuclear cold fusion with no unforeseen negative impacts), flying cars and nutrition delivered to us in pills and strangely coloured liquids in tall glasses. This is the stuff of science fiction, and very entertaining it can be too. At the other end of the scale is a scenario like Mad Max but without any of the good bits. Many people are drawn to this scenario based on their perceptions of human nature and perhaps an overdeveloped sense of pioneer spirit. More realistic perhaps are the inter-mediate third and fourth scenarios. In ‘green-tech stability’ we essentially maintain our current level of energy usage by progressively moving to renewable sources such as wind, solar, tidal power, etc., as fossil fuel reserves are used up. Permaculture defines a fourth scenario termed ‘Earth Stewardship’, a ‘creative descent’ in which we progressively reduce our energy demands to return eventually to living within the natural energy and production budget of the land we occupy. Elements of all these scenarios can be found in the wide-ranging viewpoints and arguments of today’s ‘sustainability’ debates. Culture pré-industrielle. Temps historique. Agriculture av JC. Révolution industrielle. Baby Boom. Nos petits-petits enfants... Temps.")
14
Changer le mythe de... Just thinking about the task ahead, of raising awareness of the issues and creating an environment where communities are able to unleash the local genius to devise creative ways of moving down the other side of the energy mountain, it’s interesting to see how stories might be used. It’s about how the brain works. Facts and figures are processed by the left-hand side of the brain, and that’s a fairly static unimaginative processing unit, not suited to changing behaviours. However, start engaging the right-hand side and all that changes – you’re dealing with fluidity, creativity and a processing unit that loves to play with the possibilities of change. By stories, I mean the myths and tales and truths that underpin the way we think about the world. There are myths such as: growth is good I have no power Technology will solve all our problems There is no alternative You can’t stop progress Living standards are rising New, better, faster, shinier ____ are just around the corner Humans are selfish and greedy by nature The market will solve it One myth is around oil. It’s that this process of appropriating fossil fuels has been a wonderful journey towards a peak. On that journey, the views have been getting increasingly more wonderful, that the air is cleaner up here, that the opportunities and possibilities are unlimited and we can launch ourselves off this mountain if we want and fly to the stars. What would it be like to turn that story, literally, on its head... 14

15
... à une vision plus positive !
... and this is what it would look like. We were presented with a pool, and told that there were untold riches and happiness in it. We dived right in and started swimming downwards, searching for these riches. And sometimes they were there, and sometimes they were illusory. But we kept on swimming down. It got a bit murky, and the surface started to seem a long way away. Then it became thick and treacly, and it was difficult to move through it. Vision reduced to just inches before our eyes. But we kept going down. And then we realised – we’re not suited to swimming around in poisonous gloop. And as our lungs, our eyes, our sense of smell, our clogging pores told us to get the hell out of that pool of treasures. And our task right now is to swim up through to the clearer water, back up to the surface. To haul ourselves out of that ruinous mire, wipe off the clinging remnants of gloop, take a huge lungful of clean air and say to ourselves – “never again will I take those type of risks to find treasures that were ultimately temporary at best, illusory at worst.” 15

16
Construire la résilience
« La capacité d’un système à absorber un changement perturbant et à se réorganiser en intégrant ce changement, tout en conservant essentiellement la même fonction, la même structure, la même identité et les mêmes capacités de réaction. » (déf. Walker)
")
17
Plan Le contexte Changement Climatique - Pic Pétrolier – crise économique et sociale Descente énergétique Vision positive et résilience Les ingrédients de la transition Inclusion, transition intérieure, permaculture, … Les initiatives de transition En Belgique et dans le monde Le cas d’Ixelles en Transition

18
Ingrédients/outils de la transition
Principes de la permaculture : observer et interagir, auto- régulation et rétro-action, ne produire aucun déchet, intégrer au lieu de séparer, favoriser la diversité / le marginal, utiliser des solutions « petites » et locales,… Relocalisation progressive de ce qui peut l’être Vision positive de l’avenir : visualisation / rêver ensemble « La Transition n’a pas pour but de s’opposer au système en place, mais s’efforce de développer et concrétiser une vision d’un avenir souhaitable et attractif pour tous » 18 18

19
Ingrédients/outils de la transition
Inclusivité : tout le monde est le bienvenu / a sa place ! Conscientisation Transition intérieure & Transition collective La grande requalification : apprentissage et partage de savoirs-faire Choisir des solutions crédibles et appropriées : « Choisir plutôt que subir » Transitie Evere en Transition : 19 19

20
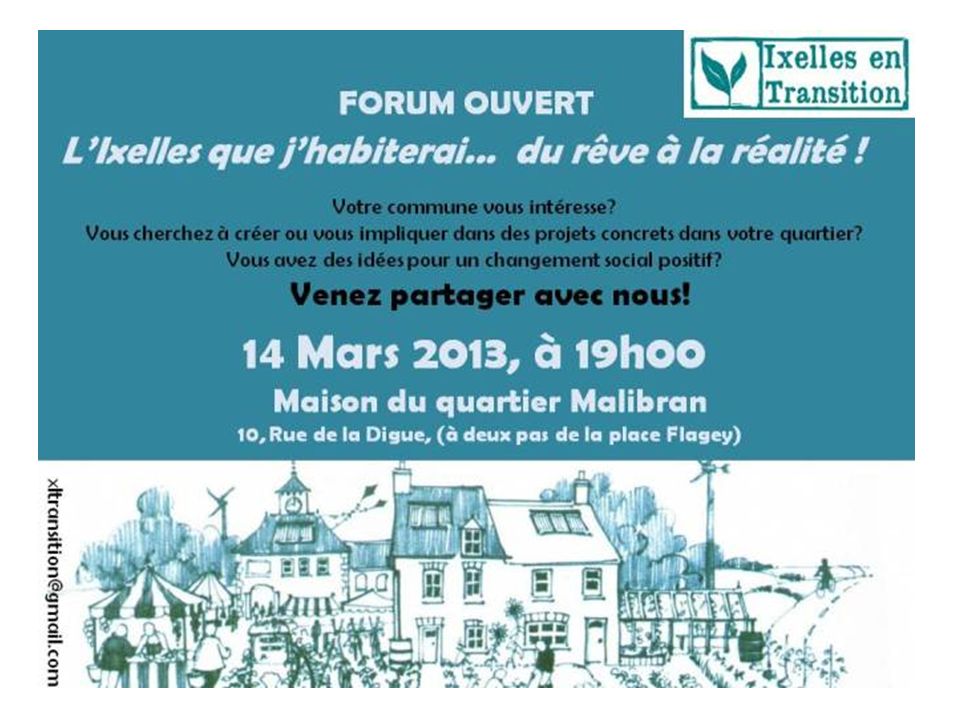
Forum ouvert 20

21
Changer à plusieurs niveaux
(1) MONDIAL: protocoles de descente énergétique, diminutions et ré-équilibrages, conférences internationales (Kyoto, Copenhague…) (2) NATIONAL: taxe carbone, normes/rationnement énergétiques… (3) LOCAL: transition et villages, quartiers, villes… (4) PERSONNEL : ré-apprentissagesde savoir- faire, …
 MONDIAL: protocoles de descente énergétique, diminutions et ré-équilibrages, conférences internationales (Kyoto, Copenhague…) (2) NATIONAL: taxe carbone, normes/rationnement énergétiques… (3) LOCAL: transition et villages, quartiers, villes… (4) PERSONNEL : ré-apprentissagesde savoir- faire, …")
22
Chaque initiative propose des solutions propre à sa réalité et locales
Dépend du contexte de la ville/du quartier La transition offre un cadre/des outils mais pas de solution tout faite. Ouverture à toutes les initiatives qui entrent dans le cadre de la transition -> fédérer La notion de « local » est à plusieurs échelles (le quartier, la commune, la ville) 22 22
")
23
Que peut-on faire au niveau local …?
Beaucoup de discussions pour éveiller les consciences, de films... Transmission des compétences Partage de graines Répertoires de producteurs locaux Monnaies locales Partage d’autos Planter des arbres fruitiers Créer des entreprises locales d'énergie renouvelable Projets de jardins partagés Conseils d'économie d'énergie à la communauté Centraliser des achats d'arbres pour des « vergers de ville » Cours de raccommodage Ateliers de réparation et recyclage Toilettes sèches... Travailler avec les écoles locales Introduire des livres sur la durabilité dans les bibliothèques SEL, GAC/GASAP, etc. Jardinage-guérilla Cours de permaculture This description relates to Totnes, where I live. However, all the other communities heading off down this track are devising equally creative ways of rebuilding resilience and reducing carbon 23

24
Plan Le contexte Changement Climatique - Pic Pétrolier – crise économique et sociale Descente énergétique Vision positive et résilience Les ingrédients de la transition Inclusion, transition intérieure, permaculture, … Les initiatives de transition En Belgique et dans le monde Le cas d’Ixelles en Transition

25
Les initiatives de transition
Transition network Australie, Brésil, Chili, Finlande, Canada, Espagne… initiatives dans le monde Le réseau Wallonie-Bruxelles Mi-2012 : Schaerbeek, Ath, Barvaux, Liège, Grey, Mons, Tervueren, La Louvière, Namur, Merchtem, … En Belgique + 40 initiatives en Belgique

26
This list of transition initiatives from around the world is growing fast. Covering the globe from Australia to Brazil, Chile to Finland, Canada to Spain, and with populations varying from 2,500 to hundreds of thousands: For communities with larger populations, the complexity of a Transition initiative increase significantly. What we’re seeing is the city splitting itself into easily manageable chunks – cities typically are an amalgamation of smaller communities, villages and towns. Some of these places are “mulling over” whether they’ll start up a full blown initiative in their locale. Others are “official” Transition Initiatives. By that, we mean that we at Transition Network know they have a reasonably sized initiating group, made up of people who have lived in that community for significant periods of time, that they understand peak oil and climate change, that they’ve educated themselves on the Transition Model, that they’re striving for inclusivity across their initiative. Many of these groups have attended training courses that deepen their understanding of the process of transition and the rationale behind it. Currently there are over 300 “officials” and more “mulling it” over than we can keep count of.

27
Plan Le contexte Changement Climatique - Pic Pétrolier – crise économique et sociale Descente énergétique Vision positive et résilience Les ingrédients de la transition Inclusion, transition intérieure, permaculture, … Les initiatives de transition En Belgique et dans le monde Le cas d’Ixelles en Transition

28
Ixelles en Transition Historique Groupe de pilotage
Avril 2011 : Premiers contacts 4 novembre 2011 : Première projection 4 janvier 2012 : Première rencontre Juin 2012 : Naissance du « groupe de pilotage » Groupe de pilotage Noyau 1 an avant dissolution De hauts et des bas Soutien structurel et organisationnel Groupes thématiques 7 février 2013 : Retrouvailles 14 mars 2013 : Forum du « rêve » … Juin 2013 – Dissolution du « groupe de pilotage »

29
A nous de jouer !

Présentations similaires