Télécharger la présentation
La présentation est en train de télécharger. S'il vous plaît, attendez

1
Evolution of the concept of logistics From Logistics to SCM
Course by J.PONS Evolution of the concept of logistics From Logistics to SCM To Accompany Russell and Taylor, Operations Management, 4th Edition, 2003 Prentice-Hall, Inc. All rights reserved.

2
Course Plan Course by J.PONS
To Accompany Russell and Taylor, Operations Management, 4th Edition, 2003 Prentice-Hall, Inc. All rights reserved.

3
Logistics Contents Introduction : from Logistics to SCM
I. Operational logistics II. Functional logistics III. Strategical logistics IV. Place of logistics in the company’s organization chart V.Place and importance of transport VI. Interface between physical & financial flows VII. Construction of an international physical flow.

4
Preambule Logistics in constant rebuiling
Course by J.PONS Preambule Logistics in constant rebuiling To Accompany Russell and Taylor, Operations Management, 4th Edition, 2003 Prentice-Hall, Inc. All rights reserved.

5
Evolution of logistics concept
Logistics, for a long time, was confined to the execution of tasks such as : transport, storage, handling, conditionning, have moved upstairs over the last twenty years and now represents a strategic function.

6
Strategic logistics challenge
Logistics & strategic feasability : Industrial Purchasing commercial No tactics without logistics «When logistics say no, it means they are right» Dwight EISENHOWER

7
Evolution of logistics concept
De facto, no current corporate strategy must be undertaken without having consulted Logistics : whether upstream with industrial strategies or purchasing strategies Whether downstream with distribution strategies which are now, under the impulsion of the OMC, one a global scale. These new strategies indeed require logistics at a more complex level in terms of customer techniques and transport.

8
Logistics in constant Rebuilding
upstream logistics rebuilding Production unit specialisation Production delocalisation Postponment crossdocking «worldwide» OEM localisation

9
Logistics in constant rebuilding
downstream logistics rebuilding Reduction of products life cycle Promotions Crossdocking E-commerce et « last mile » Global trading Logistics & Marketing

10
Logistics in constant rebuilding downstream strategies worldwide distribution
Consumption and production are more and more geographically separated (delocalisation) . Regions are spezialized in the commodities they can produce more efficiently (specialisation) Logistics activities provide the bridge between production and market locations
 . Regions are spezialized in the commodities they can produce more efficiently (specialisation) Logistics activities provide the bridge between production and market locations.")
11
Logistics in constant rebuilding
Permanent changing business logistics practices due to : Growing internationalization and globalization Shifting toward more service-oriented economies Computer software available to assist in solving practical-size problems (SCE, SCEM, APS,…)
")
12
Introduction Evolution of the logistics concept since one century
Course by J.PONS Introduction Evolution of the logistics concept since one century To Accompany Russell and Taylor, Operations Management, 4th Edition, 2003 Prentice-Hall, Inc. All rights reserved.

13
Supply Chain Mangement Evolution of logistics concept
Focus of these lessons From operational logistics through functional Logistics to strategic logistics

14
J.PONS’ cursus & Logistics evolution
Experience in operational logistics Secrétaire Général by GONDRAND Cie (3PL) Experience in functional logistics Operation manager by ALCATEL Group (imotics) Experience in sectorial logistics Operation manager by CE2M (automotive sector) Consulting (4PL) Manager by Anetys
 Experience in functional logistics. Operation manager by ALCATEL Group (imotics) Experience in sectorial logistics. Operation manager by CE2M (automotive sector) Consulting (4PL) Manager by Anetys.")
15
J.PONS’ cursus & Logistics evolution
Teacher’s cross-functional curriculum presentation : by GONDRAND : learning of the importance of mastering all the logistics tools like transportation, warehousing, packaging, handling, custom’s aspects for international supply chain : SAD, transit (T1), Common Tariff, economic customs arrangements
, Common Tariff, economic customs arrangements.")
16
SCM Operational logistics

17
1 PL or transport for own account
First level logistics 1LP or One single logistics partner To perform their logistics, companies initially managed to organize themselves with their own vehicle fleet (transport for own account).
.")
18
2PL Two-level logistics Or 2PL ( principal and logistics supplier) Most companies outsourced at least the "low levels" of logistics, starting with transport operations, working with several public carriers to atomized professions (monoparcels, groupings, lots).
 Most companies outsourced at least the low levels of logistics, starting with transport operations, working with several public carriers to atomized professions (monoparcels, groupings, lots).")
19
3PL During the middle of the 1990s Companies have discovered the benefits of hiring outside, or third party, logistics expert to manage the total flow of products. The trend towards enterprises focusing on their core activities has also affected logistics. By abandoning this function, enterprises have allowed a true market for service provision to emerge in the sector.

20
3PL Three-level logistics
or 3PL and LLP (principal, logistics supplier executors' guarantor). Then the best world management practices led companies to generally reduce the number of suppliers and mainly the number of carriers. The 3PLs gradually developed concentric service companies with stronger added value, leading to carrying out more varied tasks such as cross-docking, co-manufacturing, co-packing, tracing & tracking..
. Then the best world management practices led companies to generally reduce the number of suppliers and mainly the number of carriers. The 3PLs gradually developed concentric service companies with stronger added value, leading to carrying out more varied tasks such as cross-docking, co-manufacturing, co-packing, tracing & tracking..")
21
4PL « Supply chain integrator that assembles, manages the resources, capabilities & technology of its own organisation with those of complementary service providers to deliver a comprehensive supply chain solution» (Andersen Consulting). A 4PL is ideally placed to choose the best of breed in each category by integrating 3PL Providers, management and IT consultants to form a high-level alliance. It is through this collection of companies that a 4PL is formed, with the lead consultancy at the epicentre.
. A 4PL is ideally placed to choose the best of breed in each category by integrating 3PL Providers, management and IT consultants to form a high-level alliance. It is through this collection of companies that a 4PL is formed, with the lead consultancy at the epicentre.")
22
4PL The 4PL: Physical flow Consultant Analysts and Supply Chain Optimisers To further optimize the logistics chain, company call on specialized logistics consultants who add on a 4th level of parties involved (or 4th Party Logistics). These 4PLs can be 3PLs who are not execution subcontractors, but who plan and coordinate physical flows executed by natural operators (2PLs) or providers of a supply chain (3PLs). They innovate and thus reduce total costs.
. These 4PLs can be 3PLs who are not execution subcontractors, but who. plan and coordinate physical flows executed by natural operators (2PLs) or providers of a supply chain (3PLs). They innovate and thus reduce total costs.")
23
5 PL The 5PL: Integrators of execution software As a final development, physical flow consultants (4PL) , has to incorporate experts in the integration of logistics information systems (5PL) to fully pilot information, sharing between clients, suppliers and 3PLs.
 , has to incorporate experts in the integration of logistics information systems (5PL) to fully pilot information, sharing between clients, suppliers and 3PLs.")
24
Operational logistics
Experience by GONDRAND Transportation management Physical distribution Materials management Clearance procedure From 2PL to 3PL

25
Field of operational Logistics
Inventory maintenance Order processing Purchasing Warehousing Materials handling Packaging Customer service standards Product scheduling

26
GONDRAND operational approach : carriage, customs, warehousing
Import and export procedures. SAD : EX1nr 3 = the only relevant document for proving the export and justify the Tax Free Invoice IM4 nr 8 = delivered to the Importer and justifies the payment of eventual customs duties and taxes Inland Clearance Depot / CRD Nomenclature : Harmonised System, Combined Nomenclature 8 Binding Nomenclature Information BNI/RTC Origine: associated countries (EU & EFTA, EU & Magreb/Machrack). Binding Origin Information BOI / RTO EUR1, ATR1, Certificate of origin Form A Customs value: CIF,CIP,DAF price Release for free consumption : VAT T1 : transit title Economic customs arrangement (jobprocessing, duty suspension)
. Binding Origin Information BOI / RTO. EUR1, ATR1, Certificate of origin Form A. Customs value: CIF,CIP,DAF price. Release for free consumption : VAT. T1 : transit title. Economic customs arrangement (jobprocessing, duty suspension)")
27
Certificate of origin Form A
European Union (25) intrastat VAT Israël ACP Taiwan EFTA EUR 1 + DAU Maghreb Turkey (ATR1) Canada PTOM EUR1 +VAT Machrach GPS New Zealand Certificate of origin Form A + VAT declaration USA... Free entrance, free consumption processes
 intrastat. VAT. Israël. ACP. Taiwan. EFTA. EUR 1 + DAU. Maghreb. Turkey (ATR1) Canada. PTOM. EUR1 +VAT. Machrach. GPS. New Zealand. Certificate of origin Form A. + VAT declaration. USA... Free entrance, free consumption processes.")
28
GONDRAND operational approach : customs procedure
Import and export procedures with a Single Administration Document Export procedure with the first exemplars EX1nr 3 = the only relevant document for proving the export and justify the Tax Free Invoice IMPORT & Free Practice process (last three exemplars) IM4 nr 8 = delivered to the Importer and justifies the payment of eventual customs duties and taxes Inland Clearance Depot / CRD
 IM4 nr 8 = delivered to the Importer and justifies the payment of eventual customs duties and taxes. Inland Clearance Depot / CRD.")
29
GONDRAND operational approach : carriage, customs, warehousing
Import and export procedures. Nomenclature : Harmonised System, Combined Nomenclature 8 Binding Nomenclature Information BNI/RTC

30
GONDRAND operational approach : carriage, customs, warehousing
Import and export procedures. Origine: associated countries (EU & EFTA, EU & Magreb / Machrack, ACP, Yaoundé). Binding Origin Information BOI / RCO EUR1, ATR1, Certificate of origin Form A (China) for goods under quota.
. Binding Origin Information BOI / RCO. EUR1, ATR1, Certificate of origin. Form A (China) for goods under quota.")
31
GONDRAND operational approach : carriage, customs, warehousing
Import and export procedures. Free Practice process : customs value Release for free consumption : VAT calculation T1, T2, TIR : transit title Economic customs arrangement : job-processing, duty suspension, economic customs arrangement, temporary importation arrangements, returned goods relief, inward or outward processing relief arrangements

32
Key activities transportation
Mode and transport service selection Freight consolidation (FCL) Carrier routing Vehicle scheduling Equipment selection Claims processing Rate auditing
 Carrier routing. Vehicle scheduling. Equipment selection. Claims processing. Rate auditing.")
33
Key activities inventory management
Raw material and finidhed goods stocking policies Short-term sales forecasting Product mix at stocking points Number, size, and location of stocking points JIT, push and pull strategies

34
Key activities order processing
Sales order-inventory interface procedures Order information transmittal methods Ordering rules

35
Support activities warehousing
Support activities (depending on the circumstances) Warehousing Space determination Stock layout and dock design Warehouse configuration Stock placement
 Warehousing. Space determination. Stock layout and dock design. Warehouse configuration. Stock placement.")
36
Support activities materials handling
Equipment selection Equipment replacement policies Order picking procedures Stock storage and retrieval

37
SCM Functional logistics Logistics & Procurement

38
ALCATEL Group Imotic sector functional approach
Logistics & Purchasing function Case exposed : sourcing of EOM for active network products

39
ALCATEL Group Imotic sector functional approach
Teacher’s cross-functional curriculum presentation : by ALCATEL : learning how logistics improves purchasing and procurement functions

40
ALCATEL Group Imotic sector
« Domotic » or home automation: to make a flat « smart » like with the « blue tooth » technology of Ericson. « Imotic » : to make an Office-building « smart » Everywhere possibility to receive voice, images, data

41
ALCATEL Group Imotic sector
3 Kinds of components items : Cable : optical fiber (100 billions bits/second), coaxial cable, simple wire Leaders Pirelli, Nexans (Ex Alcatel Câble) Connectics : AMP, Areva (Framatome Connectics), AMPHENOL Active network products (modem, transceivers, repeaters) Supplier : Birktech.
, coaxial cable, simple wire. Leaders Pirelli, Nexans (Ex Alcatel Câble) Connectics : AMP, Areva (Framatome Connectics), AMPHENOL. Active network products (modem, transceivers, repeaters) Supplier : Birktech.")
42
Functional logistics experience by ALCATEL Purchasing & Logistics
Difference in the decision criteria Ex : LCL/FCL (sea carriage) « Paying load » rule (air carriage)
 « Paying load » rule (air carriage)")
43
Purchaser/Logistician decision criteria comparison
OEM Sourcing EOQ (Wilson) Stocks level Acquisition costs obsolescence Quality Production and delivery time Units Innovation & development capacities LOGISTICIAN OEM localisation Multimodal approach: Sea Air FCL/LCL, Price Quality Transit Time Units W/M ratio « paying for » rule
 Stocks level. Acquisition costs. obsolescence. Quality. Production and delivery time. Units. Innovation & development capacities. LOGISTICIAN. OEM localisation. Multimodal approach: Sea Air. FCL/LCL, Price. Quality. Transit Time. Units. W/M ratio. « paying for » rule.")
44
Weight orVolume tarification
Sea transport : 1 ton / 1cm W/M at ship’s convenience Road transport : 1 ton/ 3 cm Air transport : 1 ton / 6 cm (soon 1 ton / 5 cm) Ex : 24 cm3 and 300 Kgs. taxation : 24cm/6 = 400 Kgs
 Ex : 24 cm3 and 300 Kgs. taxation : 24cm/6 = 400 Kgs.")
45
« paying for » rule (road/air)
weight slot with degressive tariffs the « paying for » rule consists in applying to a good, a superior weight than its real weight, based on a more favorable tarification, at customer’s convenience. Ex : tarification from to 45 kg : 5€/kg 45 to 60 kg : 3€/kg Normal tarification : kg x 5 € = 200 € « paying for » rule : kg x 3 € = 135 €

46
Air / Sea 1 t 1 cm Sea 300€ Air 3000 2 cm 600€ 900€ 4 cm 1200 6 cm
1800 Volume : 6 m3 Weight : 1 tonne Air freight : 3 €/kg Sea freight : 300 € / tonnage or cubic meter

47
Tarification: air quotes
Flat rate Special rates Corates ULD / Unit Load Devices

48
Tarification : Sea quotes
flat rate (+) or (-) CAF (currency Adjustment factor) (+) or (-) BAF (bunkerage Adjustment factor) + Congestion + Outport additionnal + Hazardous + MEES
 or (-) CAF (currency Adjustment factor) (+) or (-) BAF (bunkerage Adjustment factor) + Congestion. + Outport additionnal. + Hazardous. + MEES.")
49
Functional logistics experience by CE2M
Fabrication of automotive cable bundles Logistics challenge The 7 R’s by Shigeo Shingo : Zero Inventory, Delivery Time, Defect, Paper, Incident, breakdown, Scorn

50
SCM by CE2M automotive supplier in cable bundles :
coping with the challenge and constraints of “ Seven Rs” imposed by BOSCH Gmbh (right amount of the right product at the right place at the right time in the right condition at the right price with the right information and no SCORN) JIT, lower inventory, EOQ, make to order, make to stock, assemble to order, inventory management
 JIT, lower inventory, EOQ, make to order, make to stock, assemble to order, inventory management.")
51
Right inventory zéro stock
Inventory Management To Accompany Russell and Taylor, Operations Management, 4th Edition, 2003 Prentice-Hall, Inc. All rights reserved.

52
Les Modules R/3 de SAP : Achats et stocks (MM)
• MM permet à l ’ entreprise de gérer ses stocks et son approvisionnement dans le cadre des opérations courantes. • Ses principales composantes : – Approvisionnement (achats) – Gestion des stocks – Méthode du point de commande – Contrôle de la facturation – Valorisation des stocks – Évaluation des fournisseurs – Gestion des services externes – Système d ’ information des achats et système d ’ information du contrôle des stocks.
 – Gestion des stocks. – Méthode du point de commande. – Contrôle de la facturation. – Valorisation des stocks. – Évaluation des fournisseurs. – Gestion des services externes. – Système d ’ information des achats et système d ’ information. du contrôle des stocks.")
53
Gestion des stocks Problématique
Satisfaire des besoins futurs mal connus, tout en minimisant les coûts eux-mêmes, en passant des commandes dont la livraison est soumise à aléas Les logiciels SCM ne règlent pas tout Il faut une étroite collaboration entre les services : achats, production, entretien, ventes, compta, finances, informatique, personnel, administration, magasins, DG.

54
Gestion des stocks pourquoi constituer un stock?.
Pénurie Retard livraison Hausse des prix Retard de production Stocks de pièces de rechange pour éviter arrêt de production Bénéficier remises sur prix d’achat, sur frais de port Éviter achats fréquents Objectif spéculatif Nécessité liée à saisonnalité de production (céréales) ou de la demande (jouets) Bonification de certains produits (cognac, bois) Satisfaction immédiate de la demande.
 ou de la demande (jouets) Bonification de certains produits (cognac, bois) Satisfaction immédiate de la demande.")
55
Gestion des stocks Définition et nature du stock
Ensemble des produits accumulés en attente de consommation (lorsque le produit sort du stock) Nature du stock en fonction de leur utilisation ultérieure : Produits finis vendus en l’état, produits finis prêts à la vente. Matières premières entrant dans produit fini Matières consommables nécessaires à la production et au fonctionnement de l’entreprise Emballages Produits semi-finis, semi-ouvrés, WIP Résidus de fabrication
 Nature du stock en fonction de leur utilisation ultérieure : Produits finis vendus en l’état, produits finis prêts à la vente. Matières premières entrant dans produit fini. Matières consommables nécessaires à la production et au fonctionnement de l’entreprise. Emballages. Produits semi-finis, semi-ouvrés, WIP. Résidus de fabrication.")
56
Gestion des stocks Partie constitutive du stock
Quantité en stock Stock actif Stock de protection temps Stock théorique Stock réel

57
Gestion des stocks Stock actif : partie destinée à satisfaire la demande Stock de protection ou de sécurité : partie destinée à satisfaire une demande supérieure à la moyenne prévue ou à parer aux conséquences d’un retard de livraison. Stock stratégique : pour les produits sensibles, stock fixé par DG.

58
Gestion des stocks Coût du stock
Frais d’acquisition générés par la constitution et le renouvellement du stock Frais de possession Frais de rupture générés par une défaillance du stock qui n’est plus à même de satisfaire la demande.

59
Gestion des stocks Coût du stock
Frais de rupture Très élevés, mais non chiffrables à priori Recours à l’aérien, aux intégrateurs, au lieu de solutions classiques route ou maritime. Coût de la solution de remplacement Coût d’annulation de contrat, etc…

60
II. Gestion des stocks Coût du stock
Frais d’acquisition constitués de : Frais de fonctionnement du service achats (entre et € /an/personne) Contrôle qualité Réception en magasin (10% en moyenne des frais de fonctionnement du magasin soit entre et €/an/personne) Frais de fonctionnement de la comptabilité matière (entrées en stock) entre et € / an/ personne Frais de fonctionnement de la comptabilité fournisseur et coût de l’émission des instruments de paiement des factures liées aux achats de produits stockés (30 à 60% des factures reçues), entre et € /an/personne Frais informatiques : gestion des commandes des produits stockés (12 à 30 €/article/an), gestion du stock (10 à 40 €/article/an), traitement comptable des entrées en stocks (1 à 3 €/entrée). Frais élevés qui atteignent 1,5 à 4,5% environ des achats. Frais moyens par commande : entre 40 et 300 € Frais moyens par produit :
 Contrôle qualité. Réception en magasin (10% en moyenne des frais de fonctionnement du magasin soit entre et €/an/personne) Frais de fonctionnement de la comptabilité matière (entrées en stock) entre et € / an/ personne. Frais de fonctionnement de la comptabilité fournisseur et coût de l’émission des instruments de paiement des factures liées aux achats de produits stockés (30 à 60% des factures reçues), entre et € /an/personne. Frais informatiques : gestion des commandes des produits stockés (12 à 30 €/article/an), gestion du stock (10 à 40 €/article/an), traitement comptable des entrées en stocks (1 à 3 €/entrée). Frais élevés qui atteignent 1,5 à 4,5% environ des achats. Frais moyens par commande : entre 40 et 300 € Frais moyens par produit :")
61
Gestion des stocks Politique du stock Zéro
Applicable si risque et coût de rupture faibles. Conditions à réunir : Sources d’approvisionnement sûres grâce à une sélection rigoureuse de fournisseurs-partenaires. Appareil de production souple Maintenance préventive et politique de qualité Sélection de Personnel qualifié et adhésion au projet d’entreprise.

62
Inventory Stock of items held to meet future demand
Inventory management answers two questions How much to order When to order

63
Types of Inventory Raw materials Purchased parts and supplies Labor
In-process (partially completed products) Component parts Working capital Tools, machinery, and equipment
 Component parts. Working capital. Tools, machinery, and equipment.")
64
Reasons to Hold Inventory
Meet unexpected demand Smooth seasonal or cyclical demand Meet variations in customer demand Take advantage of price discounts Hedge against price increases Quantity discounts

65
Two Forms of Demand Dependent Independent
Items used to produce final products Independent Items demanded by external customers

66
Inventory Costs Carrying Cost Ordering Cost Shortage Cost
Cost of holding an item in inventory Ordering Cost Cost of replenishing inventory Shortage Cost Temporary or permanent loss of sales when demand cannot be met

67
Inventory Control Systems
Continuous system (fixed-order-quantity) Constant amount ordered when inventory declines to predetermined level Periodic system (fixed-time-period) Order placed for variable amount after fixed passage of time
 Constant amount ordered when inventory declines to predetermined level. Periodic system (fixed-time-period) Order placed for variable amount after fixed passage of time.")
68
ABC Classification System
Demand volume and value of items vary Classify inventory into 3 categories, typically on the basis of the dollar value to the firm PERCENTAGE PERCENTAGE CLASS OF UNITS OF DOLLARS A B 30 15 C

69
ABC Classification PART UNIT COST ANNUAL USAGE 1 $ 60 90 2 350 40
1 $ 60 90 PART UNIT COST ANNUAL USAGE Example 10.1

70
ABC Classification PART UNIT COST ANNUAL USAGE 1 $ 60 90 2 350 40
1 $ 60 90 PART UNIT COST ANNUAL USAGE TOTAL % OF TOTAL % OF TOTAL PART VALUE VALUE QUANTITY % CUMULATIVE 9 $30, 8 16, 2 14, 1 5, 4 4, 3 3, 6 3, 5 3, 10 2, 7 1, $85,400 Example 10.1

71
ABC Classification A B C PART UNIT COST ANNUAL USAGE 1 $ 60 90
1 $ 60 90 PART UNIT COST ANNUAL USAGE TOTAL % OF TOTAL % OF TOTAL PART VALUE VALUE QUANTITY % CUMULATIVE 9 $30, 8 16, 2 14, 1 5, 4 4, 3 3, 6 3, 5 3, 10 2, 7 1, $85,400 A B C Example 10.1

72
ABC Classification A B C PART UNIT COST ANNUAL USAGE 1 $ 60 90
1 $ 60 90 PART UNIT COST ANNUAL USAGE TOTAL % OF TOTAL % OF TOTAL PART VALUE VALUE QUANTITY % CUMMULATIVE 9 $30, 8 16, 2 14, 1 5, 4 4, 3 3, 6 3, 5 3, 10 2, 7 1, $85,400 A B C % OF TOTAL % OF TOTAL CLASS ITEMS VALUE QUANTITY A 9, 8, B 1, 4, C 6, 5, 10, Example 10.1

73
ABC Classification C B A % of Value | | | | | | 0 20 40 60 80 100
100 – 80 – 60 – 40 – 20 – 0 – | | | | | | % of Quantity % of Value A B C

74
Assumptions of Basic EOQ Model
Demand is known with certainty and is constant over time No shortages are allowed Lead time for the receipt of orders is constant The order quantity is received all at once

75
The Inventory Order Cycle
Demand rate Time Lead time Order placed Order receipt Inventory Level Reorder point, R Order quantity, Q Figure 10.1

76
EOQ Cost Model D - annual demand Co - cost of placing order
Cc - annual per-unit carrying cost Q - order quantity Annual ordering cost = CoD Q Annual carrying cost = CcQ 2 Total cost = CoD Q CcQ 2

77
EOQ Cost Model Annual cost ($) Total Cost Slope = 0 Carrying Cost =
CcQ 2 Minimum total cost Ordering Cost = CoD Q Optimal order Qopt Order Quantity, Q Figure 10.2

78
EOQ Cost Model D - annual demand Co - cost of placing order
Cc - annual per-unit carrying cost Q - order quantity TC = CoD Q CcQ 2 = Q2 Cc TC Q 0 = C0D Qopt = 2CoD Deriving Qopt Proving equality of costs at optimal point = CoD Q CcQ 2 Q2 = 2CoD Cc Qopt = Annual ordering cost = CoD Q Annual carrying cost = CcQ 2 Total cost = CoD Q CcQ 2

79
EOQ Example 2CoD Cc Qopt = Qopt = Qopt = 2,000 yards D = 10,000 yards
Cc = $0.75 per yard Co = $150 Qopt = 2CoD Cc Qopt = 2(150)(10,000) (0.75) Qopt = 2,000 yards Example 10.2
(10,000) (0.75) Qopt = 2,000 yards. Example")
80
Q = 2,000 EOQ Example TC = + CoD Q CcQ 2 TC = +
D = 10,000 yards Cc = $0.75 per yard Co = $150 Q = 2,000 TC = CoD Q CcQ 2 TC = (150)(10,000) 2,000 (0.75)(2,000) TC = $750 + $750 = $1,500 Example 10.2
(10,000) 2,000. (0.75)(2,000) TC = $750 + $750 = $1,500. Example")
81
EOQ Example Orders per year = D/Q = 10,000/2,000 = 5 orders/year
D = 10,000 yards Cc = $0.75 per yard Co = $150 Orders per year = D/Q = 10,000/2,000 = 5 orders/year Example 10.2

82
EOQ Example Order cycle time = 311 days/(D/Q) = 311/5
D = 10,000 yards Cc = $0.75 per yard Co = $150 Order cycle time = 311 days/(D/Q) = 311/5 = 62.2 store days Example 10.2
 = 311/5. = 62.2 store days. Example")
83
EOQ with Noninstantaneous Receipt
p=production rate slope =p-d Inventory level d=demand rate Time Order receipt period Begin order receipt End order receipt Figure 10.3

84
EOQ with Noninstantaneous Receipt
Inventory level Maximum inventory level Q(1-d/p) Average inventory level (1-d/p) Q 2 Time Order receipt period Begin order receipt End order receipt Figure 10.3
 Average. inventory level. (1-d/p) Q. 2. Time. Order. receipt period. Begin. order. receipt. End. order. receipt. Figure")
85
EOQ with Noninstantaneous Receipt
p = production rate d = demand rate Maximum inventory level = Q d = Q 1 - Q p d Average inventory level = 2 TC = CoD CcQ Qopt = 2CoD Cc 1 - d p

86
Production Quantity Cc = $0.75 per yard Co = $150 D = 10,000 yards
d = 10,000/311 = 32.2 yards per day p = 150 yards per day Qopt = = = 2,256.8 yards 2CoD Cc 1 - d p 2(150)(10,000) 32.2 150 TC = = $1,329 d p CoD Q CcQ 2 Production run = = = days per order Q p 2,256.8 150 Example 10.3
(10,000) TC = = $1,329. d. p. CoD. Q. CcQ. 2. Production run = = = days per order. Q. p. 2, Example")
87
Production Quantity Cc = $0.75 per yard Co = $150 D = 10,000 yards
d = 10,000/311 = 32.2 yards per day p = 150 yards per day Number of production runs = = = 4.43 runs/year D Q 10,000 2,256.8 Maximum inventory level = Q = 2, = 1,772 yards d p 32.2 150 Qopt = = = 2,256.8 yards 2CoD Cc 1 - d p 2(150)(10,000) 32.2 150 TC = = $1,329 d p CoD Q CcQ 2 Production run = = = days per order Q p 2,256.8 150 Example 10.3
(10,000) TC = = $1,329. d. p. CoD. Q. CcQ. 2. Production run = = = days per order. Q. p. 2, Example")
88
Quantity Discounts CoD Q CcQ 2 TC = + + PD
Price per unit decreases as order quantity increases CoD Q CcQ 2 TC = PD where P = per unit price of the item D = annual demand

89
Quantity Discounts CoD Q CcQ 2 TC = + + PD
Price per unit decreases as order quantity increases CoD Q CcQ 2 TC = PD where P = per unit price of the item D = annual demand

90
Quantity Discount Model
Qopt Carrying cost Ordering cost Inventory cost ($) Q(d1 ) = 100 Q(d2 ) = 200 TC (d2 = $6 ) TC (d1 = $8 ) TC = ($10 ) Figure 10.4
 Q(d1 ) = 100. Q(d2 ) = 200. TC (d2 = $6 ) TC (d1 = $8 ) TC = ($10 ) Figure")
91
Quantity Discount QUANTITY PRICE Co = $2,500 1 - 49 $1,400
$1,400 ,100 Co = $2,500 Cc = $190 per computer D = 200 Qopt = = = 72.5 PCs 2CoD Cc 2(2500)(200) 190 TC = PD = $233,784 CoD Qopt CcQopt 2 For Q = 72.5 TC = PD = $194,105 CoD Q CcQ 2 For Q = 90 Example 10.4
(200) 190. TC = + + PD = $233,784. CoD. Qopt. CcQopt. 2. For Q = TC = + + PD = $194,105. CoD. Q. CcQ. 2. For Q = 90. Example")
92
When to Order Reorder Point is the level of inventory at which a new order is placed R = dL where d = demand rate per period L = lead time

93
Reorder Point Example Demand = 10,000 yards/year
Store open 311 days/year Daily demand = 10,000 / 311 = yards/day Lead time = L = 10 days R = dL = (32.154)(10) = yards Example 10.5
(10) = yards. Example")
94
Safety Stocks Safety stock Stockout Service level
buffer added to on hand inventory during lead time Stockout an inventory shortage Service level probability that the inventory available during lead time will meet demand

95
Variable Demand with a Reorder Point
point, R Q LT Time Inventory level Figure 10.5

96
Reorder Point with a Safety Stock
point, R Q LT Time Inventory level Safety Stock Figure 10.6

97
Reorder Point With Variable Demand
R = dL + zd L where d = average daily demand L = lead time d = the standard deviation of daily demand z = number of standard deviations corresponding to the service level probability zd L = safety stock

98
Reorder Point for a Service Level
Probability of meeting demand during lead time = service level a stockout R Safety stock dL Demand zd L Figure 10.7

99
Reorder Point for Variable Demand
The carpet store wants a reorder point with a 95% service level (a 5% stockout probability) d = 30 yards per day L = 10 days d = 5 yards per day For a 95% service level, z = 1.65 R = dL + z d L = 30(10) + (1.65)(5) (10) = yards Example 10.6
 d = 30 yards per day. L = 10 days. d = 5 yards per day. For a 95% service level, z = R = dL + z d L. = 30(10) + (1.65)(5) (10) = yards. Example")
100
Order Quantity for a Periodic Inventory System
Q = d(tb + L) + zd tb + L - I where d = average demand rate tb = the fixed time between orders L = lead time sd = standard deviation of demand zd tb + L = safety stock I = inventory level
 + zd tb + L - I. where. d = average demand rate. tb = the fixed time between orders. L = lead time. sd = standard deviation of demand. zd tb + L = safety stock. I = inventory level.")
101
Fixed-Period Model with Variable Demand
d = 6 bottles per day L= 5 days sd = 1.2 bottles I = 8 bottles tb = 60 days z = 1.65 (for a 95% service level) Q = d(tb + L) + zd tb + L - I = (6)(60 + 5) + (1.65)(1.2) = bottles
 Q = d(tb + L) + zd tb + L - I. = (6)(60 + 5) + (1.65)(1.2) = bottles.")
102
Strategic Decisions in Operations
Products Processes and Technology Capacity Human Resources Quality Facilities Sourcing Services Operating Systems Figure 2.2

103
Products & Services Make-to-order Make-to-stock Assemble-to-order
Made to customer specifications after order received Make-to-stock Made in anticipation of demand Assemble-to-order Add options according to customer specification

104
Processes & Technology
Project One-time production of product to customer order Batch production Process many jobs at same time in batch Mass production Produce large volumes of standard product for mass market Continuous production Very high volume commodity product

105
Production models and Inventory types (Zero Inventory)
according to the APICS ATP : Available To Promise (flow production) Necessity of having big inventories BTO : Built To Order (job production) Plain-carrier, prototype, little batches No needs of finish product inventories ATO : Available to Order (batch production) Postponment : car manufacturing
 Necessity of having big inventories. BTO : Built To Order (job production) Plain-carrier, prototype, little batches. No needs of finish product inventories. ATO : Available to Order (batch production) Postponment : car manufacturing.")
106
Product-Process Matrix
Volume Low High Projects Batch Production Mass Continuous Standardization Figure 2.3

107
Service-Process Matrix
Volume Low High Professional Service Service Shop Mass Service Service Factory Standardization Figure 2.4

108
2nd topic 7 "R"s & Logistics excellence
Fulfilment rate Tools Right amount DRP + JIT Right product TQM Right place DRP + ECR Right time JIT Right condition TQM Right price JIT + ABC + QFD Right information EDI + ERP + CALS XML

109
Just in…trouble zéro délai
Just-In-Time and Lean Production To Accompany Russell and Taylor, Operations Management, 4th Edition, 2003 Prentice-Hall, Inc. All rights reserved.

110
What is JIT ? Producing only what is needed, when it is needed
A philosophy An integrated management system JIT’s mandate: Eliminate all waste

111
Basic Elements of JIT Flexible resources Cellular layouts
Pull production system Kanban production control Small-lot production

112
Basic Elements of JIT Quick setups Uniform production levels
Quality at the source Total productive maintenance Supplier networks

113
Waste in Operations Figure 11.1

114
Waste in Operations Figure 11.1

115
Waste in Operations Figure 11.1

116
Flexible Resources Multifunctional (cross-trained) workers
General purpose machines Study operators and improve operations

117
Standard Operating Routine for a Worker
Sheet 1 Worker: Russell Cycle Time: 2 min Order of Operations time Operations :10 :20 :30 :40 :50 1:00 1:10 1:20 1:30 1:40 1:50 2:00 Pick up material Unload/ load machine 1 load machine 2 load machine 3 Inspect/ pack Figure 11.2

118
Cellular Layouts Group dissimilar machines in manufacturing cell to produce family of parts Work flows in one direction through cell Cycle time adjusted by changing worker paths

119
Manufacturing Cell with Worker Routes
3 Cell 1 Figure 11.3

120
Worker Routes Lengthened as Volume Decreases
Cell 5 Worker 2 Cell 2 Worker 1 Cell 1 Worker 3 Cell 3 Cell 4 Figure 11.4

121
The Pull System Material is pulled through the system when needed
Reversal of traditional push system where material is pushed according to a schedule Forces cooperation Prevents over and underproduction

122
Kanban Production Control System
Kanban card indicates standard quantity of production Derived from two-bin inventory system Kanban maintains discipline of pull production Production kanban authorizes production Withdrawal kanban authorizes movement of goods

123
A Sample Kanban

124
The Origin of Kanban a) Two-bin inventory system b) Kanban inventory
Reorder card Q - R R Q = order quantity R = reorder point - demand during lead time Figure 11.5

125
Types of Kanbans Figure 11.6

126
Types of Kanbans Figure 11.6

127
Types of Kanbans Figure 11.6

128
Types of Kanbans Kanban Square Signal Kanban Material Kanban
Marked area designed to hold items Signal Kanban Triangular kanban used to signal production at the previous workstation Material Kanban Used to order material in advance of a process Supplier Kanbans Rotate between the factory and suppliers

129
Determining Number of Kanbans
average demand during lead time + safety stock container size where N = number of kanbans or containers d = average demand over some time period L = lead time to replenish an order S = safety stock C = container size N = dL + S C

130
Determining the Number of Kanbans
d = 150 bottles per hour S = 0.10(150 x 0.5) = 7.5 L = 30 minutes = 0.5 hours C = 25 bottles dL + S C (150 x 0.5) + 7.5 25 N = = = = 3.3 kanbans or containers 25 Round up to 4 (to allow some slack) or down to 3 (to force improvement) Example 11.1
 = 7.5. L = 30 minutes = 0.5 hours C = 25 bottles. dL + S. C. (150 x 0.5) N = = = = 3.3 kanbans or containers Round up to 4 (to allow some slack) or down to 3 (to force improvement) Example")
131
Small-Lot Production Requires less space and capital investment
Moves processes closer together Makes quality problems easier to detect Makes processes more dependent on each other

132
Inventory Hides Problems

133
Lower Levels of Inventory Expose Problems

134
Components of Lead Time
Processing time Reduce number of items or improve efficiency Move time Reduce distances, simplify movements, standardize routings Waiting time Better scheduling, sufficient capacity Setup time Generally the biggest bottleneck

135
SMED Principles Separate internal setup from external setup
Convert internal setup to external setup Streamline all aspects of setup Perform setup activities in parallel or eliminate them entirely

136
Common Techniques for Reducing Setup Time
Figure 11.8

137
Common Techniques for Reducing Setup Time
Figure 11.8

138
Common Techniques for Reducing Setup Time
Figure 11.8

139
Uniform Production Results from smoothing production requirements
Kanban systems can handle +/- 10% demand changes Smooths demand across planning horizon Mixed-model assembly steadies component production

140
Mixed-Model Sequencing
Example 11.2

141
Quality at the Source Jidoka is authority to stop production line
Andon lights signal quality problems Undercapacity scheduling allows for planning, problem solving and maintenance Visual control makes problems visible Poka-yoke prevents defects

142
Visual Control Figure 11.9

143
Visual Control Figure 11.9

144
Visual Control Figure 11.9

145
Kaizen Continuous improvement Requires total employment involvement
Essence of JIT is willingness of workers to Spot quality problems Halt production when necessary Generate ideas for improvement Analyze problems Perform different functions

146
Total Productive Maintenance (TPM)
Breakdown maintenance Repairs to make failed machine operational Preventive maintenance System of periodic inspection and maintenance to keep machines operating TPM combines preventive maintenance and total quality concepts

147
TPM Requirements Design products that can be easily produced on existing machines Design machines for easier operation, changeover, maintenance Train and retrain workers to operate machines

148
TPM Requirements Purchase machines that maximize productive potential
Design preventive maintenance plan spanning life of machine

149
Supplier Policies Locate near to the customer
Use small, side loaded trucks and ship mixed loads Consider establishing small warehouses near to the customer or consolidating warehouses with other suppliers

150
Supplier Policies Use standardized containers and make deliveries according to a precise delivery schedule Become a certified supplier and accept payment at regular intervals rather than upon delivery

151
Benefits of JIT Reduced inventory Improved quality Lower costs
Reduced space requirements Shorter lead time Increased productivity Greater flexibility

152
Benefits of JIT Better relations with suppliers
Simplified scheduling and control activities Increased capacity Better use of human resources More product variety

153
JIT Implementation Use JIT to finely tune an operating system
Somewhat different in USA than Japan JIT is still evolving JIT isn’t for everyone

154
JIT in Services Competition on speed & quality
Multifunctional department store workers Work cells at fast-food restaurants Just-in-time publishing for textbooks Construction firms receiving material just as needed

155
SCM Right Time JIT or « Just in Trouble »
Integrators ; FedEx, UPS, DHL, TNT PG « Blue Banana »

157
Blue Banana The so-called « Blue Banana » belt constitutes the economic heart of the European Community, accounting for 2/3 of GNP. The regions of France (the North, the East, and the Southeast) are well placed on its periphery as sites for logistics platforms, being less congested than areas within it.
 are well placed on its periphery as sites for logistics platforms, being less congested than areas within it.")
158
II. Aircraft Companies Intern’l traffic Lufthansa (6,5 MTK)
Korean Air ways (5,7) Singapore AL (5,4) AF (4,7) BA JAL FedEx KLM Cathay Pacific United A Northwest Nippon Cargo UPS (15) National traffic FedEx (6,054) UPS (4 232) United A (0,958) Northwest A (0,765) AA Delta A L ANA China Southern A Varig Air Canada China Eastern A Total traffic FedEx (14 632) (100%) AF + KLM (9 059) UPS (7 295) (100%) Lufhansa (7 158) (14%) Singapore (6 909) (24%) Korean (6 247) (29%) JAL (5 024) (10%) AF (4 862) (25%) Cathay (4 854) (28%) China (4 600) (39%) BA (4 210) (6%) KLM (4 197) (16%) Cargolux (4 157) (98%) United A (3658) (5%) Northwest (3 578) (8%)
 Singapore AL (5,4) AF (4,7) BA. JAL. FedEx. KLM. Cathay Pacific. United A. Northwest. Nippon Cargo. UPS (15) National traffic. FedEx (6,054) UPS (4 232) United A (0,958) Northwest A (0,765) AA. Delta A L. ANA. China Southern A. Varig. Air Canada. China Eastern A. Total traffic. FedEx (14 632) (100%) AF + KLM (9 059) UPS (7 295) (100%) Lufhansa (7 158) (14%) Singapore (6 909) (24%) Korean (6 247) (29%) JAL (5 024) (10%) AF (4 862) (25%) Cathay (4 854) (28%) China (4 600) (39%) BA (4 210) (6%) KLM (4 197) (16%) Cargolux (4 157) (98%) United A (3658) (5%) Northwest (3 578) (8%)")
159
II. Accident rates since 1990
Aero Peru Cubana Air Zimbabwe China Airline Royal Jordanian Turkish Airlines Air India Egypt Air Air Tran (Value Jet) USA Korean Airways 16,7 accidents/1 million of flight 15,2 12,5 10 8,82 7,3 6,82 6,67 5,88 5,38
 USA. Korean Airways. 16,7 accidents/1 million of flight. 15,2. 12, ,82. 7,3. 6,82. 6,67. 5,88. 5,38.")
160
III. Traveler’s Airport (in Mio travelers)
Atlanta Hartsfield Chicago O’Hare LA London Dallas Tokyo Haneda Francfurt San Francisco Paris CDG Denver 73,5 72,5 61,2 60,6 60,4 51,5 42,7 40,1 38,7 36,8 (Source : Airports Council I’l)
")
161
III.Freight Airports (in MT 2000)
Memphis (Headoffice of Fedex) HK LA Tokyo NY (JFK) Anchorage Seoul Miami Francfort Chicago Singapour Louisville London (LHR) Paris (CDG) Amsterdam 2,412 1,989 1,952 1,841 1,737 1,676 1,655 1,651 1,539 1,532 1,523 1,486 1,355 1,226 1,225 (Source:Airports Council I’l)
 HK. LA. Tokyo. NY (JFK) Anchorage. Seoul. Miami. Francfort. Chicago. Singapour. Louisville. London (LHR) Paris (CDG) Amsterdam. 2,412. 1,989. 1,952. 1,841. 1,737. 1,676. 1,655. 1,651. 1,539. 1,532. 1,523. 1,486. 1,355. 1,226. 1,225 (Source:Airports Council I’l)")
162
IX. Integrators FedEx Created in 1973
3,3 m colis/day towards 210 countries employees warehouses &10 hubs 663 plains vehicules Turn over 19 M$ in 2001 Network : Memphis, Subic Bay, Dubaï, Paris. UPS Created in 1919 11,5 m colis/day towards 200 countries employees 1713 warehouses & 15 hubs 500 plains vehicules Turn over 24,8 M$

163
IX. Integrator DHL Created in 1970 228 countries 63 552 employees
3002 agences et 35 hubs 252 plains vehicules EDI Connection Turn over : 0,2 m$

164
SCM Right product TQM & 6 Sigma Defect company (cf GE) Juran, Deming
Gemba Kaizen & Gembutsu « to make the rocks lower » « to pursue the last grain into the corner » « When you are clean on the floor, you will be clean in your head »

165
KAIZEN (Zero Defect ) to keap his house in order
Seiri (trier, to sort) Seiton (ranger, to straighten) Seiso (nettoyer, to scrub) Seiketsu (systématiser, to systematize) Shitsuke (standardiser, to standardize)
 Seiton (ranger, to straighten) Seiso (nettoyer, to scrub) Seiketsu (systématiser, to systematize) Shitsuke (standardiser, to standardize)")
166
Gemba KAIZEN (Zero Defect)
Struggle against the 7 wastes (Muda) Muda (surproduction) (pull production) Muda (storage) (stock holding costs don’t create VA) Muda (refurbishing) (costly defective pieces) Muda (moving) (plant lay out) Muda (unnecessary treatment) (tasks elemination) Muda (waiting) (unbusy operator, Men muda)
 Muda (surproduction) (pull production) Muda (storage) (stock holding costs don’t create VA) Muda (refurbishing) (costly defective pieces) Muda (moving) (plant lay out) Muda (unnecessary treatment) (tasks elemination) Muda (waiting) (unbusy operator, Men muda)")
167
SCM Paperless Production ERP, WMS, SCM
Electronic Data Interchange (EDI) EDIFACT Web-EDI XML
 EDIFACT. Web-EDI. XML.")
168
Paperless production zéro papier
Enterprise Resource Planning To Accompany Russell and Taylor, Operations Management, 4th Edition, 2003 Prentice-Hall, Inc. All rights reserved.

169
Enterprise Resource Planning (ERP)
Organizes and manages a company’s business processes by sharing information across functional areas Connects with supply-chain and customer management applications

170
ERP Modules Figure 12.1

171
ERP’s Central Database
Finance & Accounting Production & Materials Management Sales & Marketing ERP Data Repository Human Resources Figure 12.2

172
ERP Implementation First step is to analyze business processes
Which processes have the biggest impact on customer relations? Which process would benefit the most from integration? Which processes should be standardized? Use of Internet portals can aid implementation

173
Customer Relationship Management (CRM)
Plans and executes business processes that involve customer interaction Changes focus from managing products to managing customers Point-of-sale data is analyzed for patterns used to predict future behavior

174
Supply Chain Management
Supply chain planning Supply chain execution Supplier relationships Distinctions between ERP and SCM are becoming increasingly blurred

175
Collaborative Product Commerce (CPC)
New product design and development and product life cycle management Integrates customers and suppliers in the design process though the entire product life cycle

176
Collaborative Product Commerce (CPC)
Customer Relationship Management (CRM) Enterprise Resource Planning (ERP) Collaborative Product Commerce (CPC) Supply Chain Management (SCM) Time to Market Time to Customer Customers Product Design Suppliers Collaborative Design Manufacture & Delivery Collaborative Manufacture DFMA Figure 12.3
 Enterprise Resource Planning (ERP) Collaborative Product Commerce (CPC) Supply Chain Management (SCM) Time to Market. Time to Customer. Customers. Product Design. Suppliers. Collaborative Design. Manufacture & Delivery. Collaborative Manufacture. DFMA. Figure")
177
Connectivity A very difficult problem
Enterprise Application Integration (EAI) solutions EDI is being replaced by XML A continuing issue
 solutions. EDI is being replaced by XML. A continuing issue.")
178
ERP and MRP MRP (material requirements planning) was the precursor to ERP Primarily a production planning and control system MRP evolved to MRP II (manufacturing resource planning) ERP and ERP II continue to extend the links through all business processes
 ERP and ERP II continue to extend the links through all business processes.")
179
Material Requirements Planning
Computerized inventory control and production planning system Schedules component items when they are needed - no earlier and no later

180
When to Use MRP Dependent and discrete items Complex products
Job shop production Assemble-to-order environments

181
Demand Characteristics
Independent demand 100 tables Dependent demand 100 x 1 = 100 tabletops 100 x 4 = 400 table legs Week 400 – 300 – 200 – 100 – No. of tables Continuous demand M T W Th F M T W Th F 400 – 300 – 200 – 100 – No. of tables Discrete demand Figure 12.4

182
Material Requirements Planning
Planned order releases Work orders Purchase orders Rescheduling notices Item master file Product structure Master production schedule Figure 12.5

183
Master Production Schedule
Drives MRP process with a schedule of finished products Quantities represent production not demand Quantities may consist of a combination of customer orders and demand forecasts Quantities represent what needs to be produced, not what can be produced

184
Master Production Schedule
PERIOD MPS ITEM Clipboard Lapdesk Lapboard Pencil Case

185
Product Structure Tree
Top clip (1) Bottom clip (1) Pivot (1) Spring (1) Rivets (2) Finished clipboard Pressboard (1) Clipboard Figure 12.6
 Bottom clip (1) Pivot (1) Spring (1) Rivets (2) Finished clipboard Pressboard (1) Clipboard. Figure")
186
Product Structure Tree
Clipboard Level 0 Level 1 Level 2 Spring (1) Bottom Clip (1) Top Clip (1) Pivot (1) Rivets (2) Clip Ass’y (1) Pressboard (1) Figure 12.6
 Bottom Clip (1) Top Clip (1) Pivot (1) Rivets (2) Clip Ass’y (1) Pressboard (1) Figure")
187
Indented Bill of Material
Clipboard ea 1 Clip Assembly ea 1 Top Clip ea 1 Bottom Clip ea 1 Pivot ea 1 Spring ea 1 Rivet ea 2 Press Board ea 1 LEVEL ITEM UNIT OF MEASURE QUANTITY

188
Specialized BOMS Phantom bills K-bills Transient subassemblies
Never stocked Immediately consumed in next stage K-bills Group small, loose parts under pseudo-item number Reduces paperwork

189
Specialized BOMS Modular bills
Product assembled from major subassemblies & customer options Modular bill kept for each major subassembly Simplifies forecasting & planning X10 Automobile example 3 x 8 x 3 x 8 x 4 = 2,304 configurations = 26 modular bills

190
Modular Bills of Material
X10 Automobile Engines Exterior color Interior Interior color Body (1 of 3) (1 of 8) (1 of 3) (1 of 8) (1 of 4) 4-Cylinder (.40) Bright red (.10) Leather (.20) Grey (.10) Sports coupe (.20) 6-Cylinder (.50) White linen (.10) Tweed (.40) Light blue (.10) Two-door (.20) 8-Cylinder (.10) Sulphur yellow (.10) Plush (.40) Rose (.10) Four-door (.30) Neon orange (.10) Off-white (.20) Station wagon (.30) Metallic blue (.10) Cool green (.10) Emerald green (.10) Black (.20) Jet black (.20) Brown (.10) Champagne (.20) B/W checked (.10) Figure 12.7
 (1 of 8) (1 of 3) (1 of 8) (1 of 4) 4-Cylinder (.40) Bright red (.10) Leather (.20) Grey (.10) Sports coupe (.20) 6-Cylinder (.50) White linen (.10) Tweed (.40) Light blue (.10) Two-door (.20) 8-Cylinder (.10) Sulphur yellow (.10) Plush (.40) Rose (.10) Four-door (.30) Neon orange (.10) Off-white (.20) Station wagon (.30) Metallic blue (.10) Cool green (.10) Emerald green (.10) Black (.20) Jet black (.20) Brown (.10) Champagne (.20) B/W checked (.10) Figure")
191
Item Master File DESCRIPTION INVENTORY POLICY
Item Pressboard Lead time 1 Item no. 734 Annual demand 5000 Item type Purch Holding cost 1 Product/sales class Comp Ordering/setup cost 50 Value class B Safety stock 0 Buyer/planner RSR Reorder point 39 Vendor/drawing EOQ 316 Phantom code N Minimum order qty 100 Unit price/cost 1.25 Maximum order qty 500 Pegging Y Multiple order qty LLC 1 Policy code 3 Table 12.4

192
Item Master File PHYSICAL INVENTORY USAGE/SALES
CODES On hand 100 YTD usage/sales 1100 Location W142 MTD usage/sales 75 On order 100 YTD receipts 1200 Allocated 75 MTD receipts 0 Cycle 3 Last receipt 8/25 Last count 9/5 Last issue 10/5 Difference -2 Cost acct Routing 00326 Engr 07142 Table 12.4

193
Basic MRP Processes Exploding the bill of material
Netting out inventory Lot sizing Time-phasing requirements

194
The MRP Matrix ITEM NAME OR NO. LLC LOW LEVEL CODE PERIOD
LOT SIZE QTY. MADE IN LT LEAD TIME Derived from MPS or planned order releases of the parent(s) Gross Requirements On order and scheduled to be received Scheduled Receipts Anticipated quantity on hand at the end of the period Projected on Hand Beg Inv Gross requirements net of inventory and scheduled receipts Net Requirements When orders need to be received Planned Order Receipts When orders need to be placed to be received on time Planned Order Releases Table 12.5
 Gross Requirements. On order and scheduled to be received. Scheduled Receipts. Anticipated quantity on hand at the end of the period. Projected on Hand. Beg Inv. Gross requirements net of inventory and scheduled receipts. Net Requirements. When orders need to be received. Planned Order Receipts. When orders need to be placed to be received on time. Planned Order Releases. Table")
195
School Mate Products Master Production Schedule 1 2 3 4 5
Clipboard Lapdesk Item Master File CLIPBOARD LAPDESK PRESSBOARD On hand On order 175 (Period 1) 0 0 (scheduled receipts) LLC 0 0 1 Lot size L4L Mult 50 Min 100 Lead time 1 1 1 Example 12.1
 0 0. (scheduled receipts) LLC Lot size L4L Mult 50 Min 100. Lead time Example")
196
School Mate Products Product Structure Record Clipboard Lapdesk
Pressboard (2) Trim (3’) Beanbag (1) Glue (4 oz) Level 0 Clip Ass’y Rivets Level 1 Example 12.1
 Trim. (3’) Beanbag. (1) Glue. (4 oz) Level 0. Clip Ass’y. Rivets. Level 1. Example")
197
School Mate Products ITEM: CLIPBOARD LLC: 0 PERIOD
LOT SIZE: L4L LT: Gross Requirements Scheduled Receipts 175 Projected on Hand 25 Net Requirements Planned Order Receipts Planned Order Releases Example 12.1

198
School Mate Products (25 + 175) = 200 units available
ITEM: CLIPBOARD LLC: 0 PERIOD LOT SIZE: L4L LT: Gross Requirements Scheduled Receipts 175 Projected on Hand 25 Net Requirements 0 Planned Order Receipts Planned Order Releases ( ) = 200 units available
 = 200 units available.")
199
School Mate Products (25 + 175) = 200 units available
ITEM: CLIPBOARD LLC: 0 PERIOD LOT SIZE: L4L LT: Gross Requirements Scheduled Receipts 175 Projected on Hand Net Requirements 0 Planned Order Receipts Planned Order Releases ( ) = 200 units available ( ) = 115 on hand at the end of Period 1
 = 200 units available. ( ) = 115 on hand at the end of Period 1.")
200
School Mate Products 115 units available at the beginning of Period 1
ITEM: CLIPBOARD LLC: 0 PERIOD LOT SIZE: L4L LT: Gross Requirements Scheduled Receipts 175 Projected on Hand Net Requirements 0 0 Planned Order Receipts Planned Order Releases 115 units available at the beginning of Period 1 ( ) = 20 on hand at the end of Period 2
 = 20 on hand at the end of Period 2.")
201
School Mate Products 20 units available at the beginning of Period 3
( ) = -100 Since this result is negative, it means that 100 additional Clipboards are required at the beginning of Period 3 ITEM: CLIPBOARD LLC: 0 PERIOD LOT SIZE: L4L LT: Gross Requirements Scheduled Receipts 175 Projected on Hand Net Requirements Planned Order Receipts Planned Order Releases
 = -100 Since this result is negative, it means that 100 additional Clipboards are required at the beginning of Period 3. ITEM: CLIPBOARD LLC: 0 PERIOD. LOT SIZE: L4L LT: Gross Requirements Scheduled Receipts 175. Projected on Hand Net Requirements Planned Order Receipts. Planned Order Releases.")
202
Since the lot size for this item is L4L, we plan to have an order receipt of 100 additional Clipboards at the beginning of Period 3 School Mate Products ITEM: CLIPBOARD LLC: 0 PERIOD LOT SIZE: L4L LT: Gross Requirements Scheduled Receipts 175 Projected on Hand Net Requirements Planned Order Receipts 100 Planned Order Releases

203
Since the LT for this item is 1 period, we plan to place this order at the beginning of Period 2 so that it received at the beginning of Period 3. This is known as the lead time offset School Mate Products ITEM: CLIPBOARD LLC: 0 PERIOD LOT SIZE: L4L LT: Gross Requirements Scheduled Receipts 175 Projected on Hand Net Requirements Planned Order Receipts 100 Planned Order Releases 100 Example 12.1

204
Following the same logic, use the Gross Requirements in Periods 4 and 5 and develop Net Requirements, Planned Order Receipts, and Planned Order Releases School Mate Products ITEM: CLIPBOARD LLC: 0 PERIOD LOT SIZE: L4L LT: Gross Requirements Scheduled Receipts 175 Projected on Hand Net Requirements Planned Order Receipts Planned Order Releases

205
School Mate Products ITEM: LAPDESK LLC: 0 PERIOD
LOT SIZE: MULT 50 LT: Gross Requirements Scheduled Receipts Projected on Hand Net Requirements Planned Order Receipts Planned Order Releases Example 12.1

206
School Mate Products ITEM: LAPDESK LLC: 0 PERIOD LOT SIZE: MULT 50 LT: Gross Requirements Scheduled Receipts Projected on Hand Net Requirements Planned Order Receipts Planned Order Releases Following the same logic, the Lapdesk MRP matrix is completed as shown Example 12.1

207
School Mate Products ITEM: PRESSBOARD LLC: 0 PERIOD
ITEM: CLIPBOARD LLC: 0 PERIOD LOT SIZE: L4L LT: Planned Order Releases ITEM: LAPDESK LLC: 0 PERIOD LOT SIZE: MULT 50 LT: Planned Order Releases ITEM: PRESSBOARD LLC: 0 PERIOD LOT SIZE: MIN 100 LT: Gross Requirements Scheduled Receipts Projected on Hand 150 Net Requirements Planned Order Receipts Planned Order Releases Example 12.1

208
School Mate Products x1 x1 x1 x2 x2 ITEM: PRESSBOARD LLC: 0 PERIOD
ITEM: CLIPBOARD LLC: 0 PERIOD LOT SIZE: L4L LT: Planned Order Releases x1 ITEM: LAPDESK LLC: 0 PERIOD LOT SIZE: MULT 50 LT: x1 x1 Planned Order Releases ITEM: PRESSBOARD LLC: 0 PERIOD LOT SIZE: MIN 100 LT: x2 x2 Gross Requirements Scheduled Receipts Projected on Hand 150 Net Requirements Planned Order Receipts Planned Order Releases Example 12.1

209
School Mate Products ITEM: PRESSBOARD LLC: 0 PERIOD
ITEM: CLIPBOARD LLC: 0 PERIOD LOT SIZE: L4L LT: Planned Order Releases ITEM: LAPDESK LLC: 0 PERIOD LOT SIZE: MULT 50 LT: Planned Order Releases ITEM: PRESSBOARD LLC: 0 PERIOD LOT SIZE: MIN 100 LT: Gross Requirements Scheduled Receipts Projected on Hand Net Requirements Planned Order Receipts Planned Order Releases Example 12.1

210
School Mate Products Planned Order Report PERIOD ITEM 1 2 3 4 5
Clipboard Lapdesk Pressboard Example 12.1

211
MRP Outputs Planned orders
Work orders Purchase orders Changes to previous plans or existing schedules Action notices Rescheduling notices

212
Planned Order Report Item #2740 Date 9 - 25 - 02
On hand 100 Lead time 2 weeks On order 200 Lot size 200 Allocated 50 Safety stock 50 SCHEDULED PROJECTED DATE ORDER NO. GROSS REQS. RECEIPTS ON HAND ACTION 50 9-26 AL 9-30 AL 10-01 GR 10-08 SR Expedite SR 10-01 10-10 CO 10-15 GR 10-23 GR 10-27 GR Release PO 10-13 Key: AL = allocated WO = work order CO = customer order SR = scheduled receipt PO = purchase order GR = gross requirement Table 12.6

213
MRP Action Report Current date 9-25-02 ITEM DATE ORDER NO. QTY. ACTION
# Expedite SR 10-01 # Move forward PO 10-07 # Move forward PO 10-05 # Move backward PO 10-25 # De-expedite SR 10-30 # Release PO 10-13 # Release WO 10-24 Table 12.7

214
Capacity Requirements Planning (CRP)
Computerized system that projects load from material plan Creates load profile Identifies underloads and overloads

215
Usually expressed as standard machine hours or labor hours
Capacity Usually expressed as standard machine hours or labor hours Capacity = (no. machines or workers) x (no. shifts) x (utilization) x (efficiency)
 x (no. shifts) x (utilization) x (efficiency)")
216
Capacity Terms Load profile Capacity Utilization
Compares released and planned orders with work center capacity Capacity Productive capability; includes utilization and efficiency Utilization Percentage of available working time spent working

217
More Capacity Terms Efficiency Load Load percent
The standard hours of work assigned to a facility Load percent The ratio of load to capacity Load percent = (load/capacity)x100%
x100%")
218
Capacity Requirements Planning
MRP planned order releases Routing file Capacity requirements planning Open orders Load profile for each machine center Figure 12.8

219
Determining Loads and Capacities
2 copiers, 2 operators 5 days/wk, 8 hr/day 1/2 hr meals, 1/2 hr maintenance per day Efficiency = 100% Utilization = 7/8 = 87.5% Daily capacity = 2 machines x 2 shifts x 8 hours/shift x 100% efficiency x 87.5% utilization = 28 hours or 1,680 minutes Example 12.2

220
Determining Loads and Capacities
JOB NO. OF SETUP RUN TIME NO. COPIES TIME (MIN) (MIN/UNIT) TOTAL TIME (500 x 0.08) = 45.2 20 1, (1,000 x 0.10) = 110.6 30 5, (5,000 x 0.12) = 603.4 40 10, (10,000 x 0.14) = 1,411.2 50 2, (2,000 x 0.10) = 215.3 2,385.7 min Load percent = 2,385.7 / 1,680 = 1.42 x 100% = 142% Add another shift: Daily capacity = 2 machines x 3 shifts x 8 hours/shift x 100% efficiency x 87.5% utilization = 42 hours or 2,520 minutes Revised load percent = 2,385.7/2,520 = x100% = 94.67%
 (MIN/UNIT) TOTAL TIME (500 x 0.08) = , (1,000 x 0.10) = , (5,000 x 0.12) = , (10,000 x 0.14) = 1, , (2,000 x 0.10) = ,385.7 min. Load percent = 2,385.7 / 1,680 = 1.42 x 100% = 142% Add another shift: Daily capacity = 2 machines x 3 shifts x 8 hours/shift. x 100% efficiency x 87.5% utilization. = 42 hours or 2,520 minutes. Revised load percent = 2,385.7/2,520 = x100% = 94.67%")
221
Initial Load Profile Hours of capacity Normal capacity Time (weeks)
Time (weeks) Normal capacity 120 – 110 – 100 – 90 – 80 – 70 – 60 – 50 – 40 – 30 – 20 – 10 – 0 – Figure 12.9
 Normal. capacity. 120 – 110 – 100 – 90 – 80 – 70 – 60 – 50 – 40 – 30 – 20 – 10 – 0 – Figure")
222
Remedies for Underloads
Acquire more work Pull work ahead that is scheduled for later time periods Reduce normal capacity

223
Remedies for Overloads
Eliminate unnecessary requirements Reroute jobs to alternative machines or work centers Split lots between two or more machines Increase normal capacity Subcontract Increase the efficiency of the operation Push work back to later time periods Revise master schedule

224
Adjusted Load Profile Hours of capacity Normal capacity Time (weeks)
Time (weeks) Normal capacity 120 – 110 – 100 – 90 – 80 – 70 – 60 – 50 – 40 – 30 – 20 – 10 – 0 – Pull ahead Push back Overtime Work an extra shift Figure 12.10
 Normal. capacity. 120 – 110 – 100 – 90 – 80 – 70 – 60 – 50 – 40 – 30 – 20 – 10 – 0 – Pull ahead. Push back. Overtime. Work an extra shift. Figure")
225
Relaxing MRP Assumptions
Material is not always the constraining resource Lead times can vary Not every transaction needs to be recorded JIT can be used with MRP The shop floor may require a more sophisticated scheduling system

226
Manufacturing Resource Planning (MRP II)
Forecast Aggregate production plan Customer orders Feasible? Master production schedule Material requirements planning Capacity requirements planning Purchase orders Work orders Inventory Shop floor control Manufacture No Yes Feedback Figure 12.11

227
Manufacturing Resource Planning (MRP II)
Forecast Aggregate production plan Customer orders Feasible? Master production schedule Material requirements planning Capacity requirements planning Purchase orders Work orders Inventory Shop floor control Manufacture No Yes Feedback Forecast Aggregate production plan Customer orders Feasible? Master production schedule No Yes Figure 12.11

228
Manufacturing Resource Planning (MRP II)
Forecast Aggregate production plan Customer orders Feasible? Master production schedule Material requirements planning Capacity requirements planning Purchase orders Work orders Inventory Shop floor control Manufacture No Yes Feedback Master production schedule Material requirements planning Capacity requirements planning Feasible? Yes No Figure 12.11

229
Manufacturing Resource Planning (MRP II)
Forecast Aggregate production plan Customer orders Feasible? Master production schedule Material requirements planning Capacity requirements planning Purchase orders Work orders Inventory Shop floor control Manufacture No Yes Feedback Inventory Shop floor control Manufacture Purchase orders Work orders Figure 12.11

230
Enterprise Software Collect, analyze, and make decisions based on data
ERP - Enterprise Resource Planning Managing wide range of processes Human resources, materials management, supply chains, accounting, finance, manufacturing, sales force automation, customer service, customer order entry Finding hidden patterns through data mining

231
Advanced Communications
Electronic data interchange (EDI) Internet, extranets Wireless communications Teleconferencing & telecommuting Bar coding, RFT Virtual reality
 Internet, extranets. Wireless communications. Teleconferencing & telecommuting. Bar coding, RFT. Virtual reality.")
232
Manufacturing Technology
Numerically controlled (NC) machines Controlled by punched tape Computer numerical controlled (CNC) Controlled by attached computer Direct numerical control (DNC) Several NC machines controlled by single computer Flexible manufacturing systems (FMS) Includes automated material handling
 machines. Controlled by punched tape. Computer numerical controlled (CNC) Controlled by attached computer. Direct numerical control (DNC) Several NC machines controlled by single computer. Flexible manufacturing systems (FMS) Includes automated material handling.")
233
Automated Material Handling
Conveyors Automated guided vehicle (AGV) Automated storage & retrieval system (ASRS)
 Automated storage & retrieval system (ASRS)")
234
Flexible Manufacturing Systems (FMS)
Programmable machine tools Controlled by common computer network Combines flexibility with efficiency Reduces setup & queue times

235
Flexible Manufacturing System
Parts Finished goods Computer control room Terminal CNC Machine Pallet Automatic tool changer Figure 4.13

236
Robotics Programmable manipulators Follow specified path
Better than humans with respect to Hostile environments Long hours Consistency Adoption has been slowed by ineffective integration and adaptation of systems

237
SCM No Breakdown (Total Productive Maintenance)
")
238
SCM « one stitch in time saves nine » No Breakdown
Mean Time Between Failure (MTBF) Mean Time to Repair (MTTR) Corrective, curative, predictive maintenance
 Mean Time to Repair (MTTR) Corrective, curative, predictive maintenance.")
239
Evolution of the concept of logistics From Logistics to SCM
Course by J.PONS Evolution of the concept of logistics From Logistics to SCM To Accompany Russell and Taylor, Operations Management, 4th Edition, 2003 Prentice-Hall, Inc. All rights reserved.

240
Original Process Layout
B Raw materials Assembly 1 2 3 4 5 6 7 8 9 10 11 12 Figure 5.8

241
Cellular Layout 3 6 9 Assembly 1 2 4 8 10 5 7 11 12 A B C
Raw materials Cell 1 Cell 2 Cell 3 Figure 5.9

242
SCM No scorn (contempt, disdain) empowerment enablement enlargment
collaborative relationship

243
Strategic logistics Course by J.PONS
To Accompany Russell and Taylor, Operations Management, 4th Edition, 2003 Prentice-Hall, Inc. All rights reserved.

244
Ideal Position of the logistics function to face the challenge

245
Supply Chain Management
SCM R & D Conception Human Resources Purchasing Suppliers Board Finance Production Plant Quality Logistics Distribution B to B Marketing Client B to C ERP APS Fonctional links Operational links Information links

247
Blue Banana The so-called « Blue Banana » belt constitutes the economic heart of the European Community, accounting for 2/3 of GNP. The regions of France (the North, the East, and the Southeast) are well placed on its periphery as sites for logistics platforms, being less congested than areas within it.
 are well placed on its periphery as sites for logistics platforms, being less congested than areas within it.")
248
II. Aircraft Companies Intern’l traffic Lufthansa (6,5 MTK)
Korean Air ways (5,7) Singapore AL (5,4) AF (4,7) BA JAL FedEx KLM Cathay Pacific United A Northwest Nippon Cargo UPS (15) National traffic FedEx (6,054) UPS (4 232) United A (0,958) Northwest A (0,765) AA Delta A L ANA China Southern A Varig Air Canada China Eastern A Total traffic FedEx (14 632) (100%) AF + KLM (9 059) UPS (7 295) (100%) Lufhansa (7 158) (14%) Singapore (6 909) (24%) Korean (6 247) (29%) JAL (5 024) (10%) AF (4 862) (25%) Cathay (4 854) (28%) China (4 600) (39%) BA (4 210) (6%) KLM (4 197) (16%) Cargolux (4 157) (98%) United A (3658) (5%) Northwest (3 578) (8%)
 Singapore AL (5,4) AF (4,7) BA. JAL. FedEx. KLM. Cathay Pacific. United A. Northwest. Nippon Cargo. UPS (15) National traffic. FedEx (6,054) UPS (4 232) United A (0,958) Northwest A (0,765) AA. Delta A L. ANA. China Southern A. Varig. Air Canada. China Eastern A. Total traffic. FedEx (14 632) (100%) AF + KLM (9 059) UPS (7 295) (100%) Lufhansa (7 158) (14%) Singapore (6 909) (24%) Korean (6 247) (29%) JAL (5 024) (10%) AF (4 862) (25%) Cathay (4 854) (28%) China (4 600) (39%) BA (4 210) (6%) KLM (4 197) (16%) Cargolux (4 157) (98%) United A (3658) (5%) Northwest (3 578) (8%)")
249
II. Accident rates since 1990
Aero Peru Cubana Air Zimbabwe China Airline Royal Jordanian Turkish Airlines Air India Egypt Air Air Tran (Value Jet) USA Korean Airways 16,7 accidents/1 million of flight 15,2 12,5 10 8,82 7,3 6,82 6,67 5,88 5,38
 USA. Korean Airways. 16,7 accidents/1 million of flight. 15,2. 12, ,82. 7,3. 6,82. 6,67. 5,88. 5,38.")
250
III. Traveler’s Airport (in Mio travelers)
Atlanta Hartsfield Chicago O’Hare LA London Dallas Tokyo Haneda Francfurt San Francisco Paris CDG Denver 73,5 72,5 61,2 60,6 60,4 51,5 42,7 40,1 38,7 36,8 (Source : Airports Council I’l)
")
251
III.Freight Airports (in MT 2000)
Memphis (Headoffice of Fedex) HK LA Tokyo NY (JFK) Anchorage Seoul Miami Francfort Chicago Singapour Louisville London (LHR) Paris (CDG) Amsterdam 2,412 1,989 1,952 1,841 1,737 1,676 1,655 1,651 1,539 1,532 1,523 1,486 1,355 1,226 1,225 (Source:Airports Council I’l)
 HK. LA. Tokyo. NY (JFK) Anchorage. Seoul. Miami. Francfort. Chicago. Singapour. Louisville. London (LHR) Paris (CDG) Amsterdam. 2,412. 1,989. 1,952. 1,841. 1,737. 1,676. 1,655. 1,651. 1,539. 1,532. 1,523. 1,486. 1,355. 1,226. 1,225 (Source:Airports Council I’l)")
252
IX. Integrators FedEx Created in 1973
3,3 m colis/day towards 210 countries employees warehouses &10 hubs 663 plains vehicules Turn over 19 M$ in 2001 Network : Memphis, Subic Bay, Dubaï, Paris. UPS Created in 1919 11,5 m colis/day towards 200 countries employees 1713 warehouses & 15 hubs 500 plains vehicules Turn over 24,8 M$

253
IX. Integrator DHL Created in 1970 228 countries 63 552 employees
3002 agences et 35 hubs 252 plains vehicules EDI Connection Turn over : 0,2 m$

254
Contribution of Logistics to the value of the products
Logistics & Marketing Logistics is a success key factor for : Availibility, Timeliness, Delivery in good condition, Responsiveness Time to market = Logistics and 7 "R"s

255
Supply Chain Mangement strategical logistics
Mission of a Logistician To set the level of logistics activities so as to make products and services available to customers : - at the time, place and in the condition and form desired _ in the most profitable or cost-effective way.

256
Business Logistics defined scope and content
Customer service standards set the level of output and degree of readiness to which the logistics system must respond Logistics costs increase in proportion to the level of customer service provided

257
SCM Operationnal logistics Logistics entails in 5 layers

258
SCM and LOGISTICS R & D Conception Purchasing Suppliers Production
Plant Logistics Marketing Distribution B to B upperdown logistics Client B to C Upperstream Log Pull EDI Upstream Log Board Internal Log EDI Pull Downstream Log Fonctional links Operational links Information links

259
SCM Downstream logistics : «last mile » (B2C)
Downstream logistics & DRP (B2B) tools : ECR, CRM,CPFR, JIT, CMI, VMI Internal logistics MRP2, JIT, KANBAN, POKA YOKE, JIDOKA, SMED, OTED, TAKTIME Upstream Logistics Upperstream logistics (simultaneous and concurrent logistics, Value analysis) & reverse logistics
 tools : ECR, CRM,CPFR, JIT, CMI, VMI. Internal logistics. MRP2, JIT, KANBAN, POKA YOKE, JIDOKA, SMED, OTED, TAKTIME. Upstream Logistics. Upperstream logistics (simultaneous and concurrent logistics, Value analysis) & reverse logistics.")
260
«Last mile» logistics Modern logistics alters the relationship between the producer and the end user of a product, by making it possible to do without intermedaries. However, this brings new constraints to bear on the supply chain.

261
SCM Upperstream logistics & reverse logistics
simultaneous and concurrent logistics, Value analysis Design for cost & reverse logistics

262
LOGISTICS TOOLS Reverse Concurrent engineering
R & D Conception Purchasing Suppliers Production Plant Logistics Distribution Marketing Reverse Logistics Concurrent engineering simultaneous engineering SRM TQM QFD ABC JIT, Kanban, Jidoka Poka, Yoké, MRP2... Board EDI JIT ECR CRM DRP Fonctional links Operational links Information links

263
Third Party Logistics R & D Conception Purchasing Production Suppliers
Plant Marketing Distribution Concurrent engineering simultaneous engineering reverse logistics Performance metrics Co-manufacturing, crossdocking co-packing, warehousing Logistics providers Board EDI Continuous replenishment, carrier selection & rate negotiation, shipment planning, order processing, packaging, product return, e-trade Fonctional links Operational links Information links

264
Logistics & Marketing Key activities customer service standards
Key activities (in every logistics channels) Customer service standards : cooperate with marketing to Determine customer needs and wants for logistics customer service Determine customer response to service (ECR) Set customer service levels
 Customer service standards : cooperate with marketing to. Determine customer needs and wants for logistics customer service. Determine customer response to service (ECR) Set customer service levels.")
265
Product Design Specifies materials Determines dimensions & tolerances
Defines appearance Sets performance standards

266
Service Design Specifies what the customer is to experience
Physical items Sensual benefits Psychological benefits

267
An Effective Design Process
Matches product/service characteristics with customer needs Meets customer requirements in simplest, most cost-effective manner Reduces time to market Minimizes revisions

268
Stages in the Design Process
Idea Generation — Product/Service Concept Feasibility Study — Performance Specifications Preliminary Design — Prototype Final Design — Final Design Specifications Process Planning — Manufacturing Specifications

269
New product or service launch Revising and testing prototypes
The Design Process Pilot run and final tests New product or service launch Final design & process plans Idea generation Feasibility study Product or service concept Performance specifications Functional design Form design Production design Revising and testing prototypes Design specifications Manufacturing or delivery specifications Suppliers R&D Customers Marketing Competitors Figure 3.1

270
Idea Generation Suppliers, distributors, salespersons
Trade journals and other published material Warranty claims, customer complaints, failures Customer surveys, focus groups, interviews Field testing, trial users Research and development

271
More Idea Generators Perceptual Maps Benchmarking Reverse engineering
Visual comparison of customer perceptions Benchmarking Comparing product/service against best-in-class Reverse engineering Dismantling competitor’s product to improve your own product

272
Feasibility Study Market Analysis Economic Analysis
Technical / Strategic Analysis Performance Specifications

273
Preliminary Design Create form & functional design Build prototype
Test prototype Revise prototype Retest

274
Form Design (How the Product Looks)
Cellular Personal Safety Alarm Personal Computer

275
Functional Design (How the Product Performs)
Reliability Probability product performs intended function for specified length of time under normal conditions of use Maintainability Ease and/or cost or maintaining/repairing product

276
Computing Reliability
Components in series 0.90 0.90 x 0.90 = 0.81 Components in parallel 0.95 0.90 R2 R1 Backup Original 1-[(1-.95)(1-.90)]= 1-[(.05)(.10)]= 1-[.005]=.995
(1-.90)]= 1-[(.05)(.10)]= 1-[.005]=.995.")
277
Other Measures of Reliability/Maintainability
Mean time between failures (MTBF) – length of time a product or service is in operation before it fails Maintainability (Serviceability) – ease and/or cost with which the product or service is maintained or repaired Mean time to repair (MTTR) System Availability
 – length of time a product or service is in operation before it fails. Maintainability (Serviceability) – ease and/or cost with which the product or service is maintained or repaired. Mean time to repair (MTTR) System Availability.")
278
Production Design How will the product be made?
Part of the preliminary design phase Simplification Standardization Modularity

279
Design Simplification
(a) The original design (b) Revised design One-piece base & elimination of fasteners (c) Final design Design for push-and-snap assembly Assembly using common fasteners Figure 3.3
 The original design. (b) Revised design. One-piece base & elimination of fasteners. (c) Final design. Design for push-and-snap. assembly. Assembly using. common fasteners. Figure 3.3.")
280
Final Design & Process Plans
Produce detailed drawings & specifications Create workable instructions for manufacture Select tooling & equipment Prepare job descriptions Determine operation & assembly order Program automated machines

281
Improving the Design Process
Design teams Concurrent design Design for manufacture & assembly Design to prevent failures and ensure value Design for environment Measure design quality Utilize quality function deployment Design for robustness Engage in collaborative design

282
Figure 3.4 Breaking Down Barriers to Effective Design

283
Design Teams Marketing, manufacturing, engineering
Suppliers, dealers, customers Lawyers, accountants, insurance companies

284
Concurrent Design Improves quality of early design decisions
Design decisions overlap Decentralized - suppliers complete detailed design Incorporates production process Often uses a price-minus system Scheduling and management can be complex as tasks are done in parallel

285
General Performance Specifications
Instructions to supplier: “Design a set of brakes that can stop a 2200 pound car from 60 miles per hour in 200 feet ten times in succession without fading. The brakes should fit into a space 6” x 8” x 10” at the end of each axle and be delivered to the assembly plant for $40 a set.” Supplier submits design specifications and prepares a prototype for testing

286
Design for Manufacture and Assembly
Design a product for easy & economical production Incorporate production design early in the design phase Improves quality and reduces costs Shortens time to design and manufacture

287
DFM Guidelines Minimize the number of parts, tools, fasteners, and assemblies Use standard parts and repeatable processes Modular design Design for ease of assembly, minimal handling Allow for efficient testing and parts replacement

288
Design for Assembly (DFA)
Procedure for reducing number of parts Evaluate methods for assembly Determine assembly sequence

289
Design Review Failure Mode and Effects Analysis (FMEA)
A systematic approach for analyzing causes & effects of failures Prioritizes failures Attempts to eliminate causes Fault Tree Analysis (FTA) Study interrelationship between failures
 Study interrelationship between failures.")
290
Figure 3.5 Fault Tree for Potato Chips

291
FMEA for Potato Chips Stale
FAILURE MODE CAUSE OF FAILURE EFFECT OF FAILURE CORRECTIVE ACTION Stale Low moisture content, expired shelf life, poor packaging Tastes bad, won’t crunch, thrown out, lost sales Add m cure longer, better package seal, shorter shelf life Broken Too thin, too brittle, rough handling, rough use, poor packaging Can’t dip, poor display, injures mouth, chocking, perceived as old, lost sales Change recipe, change process, change packaging Too Salty Outdated receipt, process not in control, uneven distribution of salt Eat less, drink more, health hazard, lost sales Experiment with recipe, experiment with process, introduce low salt version Table 3.1

292
Value Analysis (Value Engineering)
Improve the ratio of value/cost Assessment of value : 1. Can we do without it? 2. Does it do more than is required? 3. Does it cost more than it is worth? 4. Can something else do a better job 5. Can it be made by less costly method, tools, material? 6. Can it be made cheaper, better or faster by someone else?

293
Design for Environment
Design from recycled material Use materials which can be recycled Design for ease of repair Minimize packaging Minimize material & energy used during manufacture, consumption & disposal

294
Figure 3.6 Design for Environment

295
Metrics for the Quality of Design
Percent of revenue from new products or services Percent of products capturing 50% or more of the market Percent of process initiatives yielding a 50% or more improvement in effectiveness Percent of suppliers engaged in collaborative design

296
Metrics for the Quality of Design
Percent of parts that can be recycled Percent of parts used in multiple products Average number of components per product Percent of parts with no engineering change orders Things gone wrong

297
Quality Function Deployment (QFD)
Translates the “voice of the customer” into technical design requirements Displays requirements in matrix diagrams First matrix called “house of quality” Series of connected houses

298
Design characteristics Customer requirements Competitive assessment
House of Quality Trade-off matrix Design characteristics Customer requirements Target values Relationship matrix Competitive assessment Importance 1 2 3 4 5 6 Figure 3.7

299
Competitive Assessment
House of Quality Figure 3.8 Irons well Easy and safe to use Competitive Assessment Customer Requirements Presses quickly 9 B A X Removes wrinkles 8 AB X Doesn’t stick to fabric 6 X BA Provides enough steam AB X Doesn’t spot fabric 6 X AB Doesn’t scorch fabric 9 A XB Heats quickly 6 X B A Automatic shut-off ABX Quick cool-down 3 X A B Doesn’t break when dropped 5 AB X Doesn’t burn when touched 5 AB X Not too heavy 8 X A B

300
House of Quality Figure 3.9 Customer Requirements
Time required to reach 450º F Time to go from 450º to 100º Protective cover for soleplate Material used in soleplate Flow of water from holes Energy needed to press Thickness of soleplate Automatic shutoff Size of soleplate Number of holes Weight of iron Size of holes Customer Requirements Presses quickly Removes wrinkles Doesn’t stick to fabric Provides enough steam Doesn’t spot fabric Doesn’t scorch fabric Heats quickly Automatic shut-off Quick cool-down Doesn’t break when dropped Doesn’t burn when touched Not too heavy Irons well Easy and safe to use House of Quality

301
House of Quality + - Figure 3.10 Protective cover for soleplate
Time to go from 450º to 100º Time required to reach 450º Material used in soleplate Flow of water from holes Energy needed to press Thickness of soleplate Automatic shutoff Size of soleplate Number of holes Weight of iron Size of holes - +

302
House of Quality Figure 3.11
Protective cover for soleplate Time to go from 450º to 100º Time required to reach 450º Material used in soleplate Flow of water from holes Energy needed to press Thickness of soleplate Automatic shutoff Size of soleplate Number of holes Weight of iron Size of holes Units of measure ft-lb lb in. cm ty ea mm oz/s sec sec Y/N Y/N Iron A x4 2 SS N Y Iron B x4 1 MG N Y Our Iron (X) x5 4 T N Y Estimated impact Estimated cost Targets x5 3 SS Design changes * * * * * * * Objective measures Figure 3.11
 x5 4 T N Y. Estimated impact Estimated cost Targets 1.2 8x5 3 SS Design changes * * * * * * * Objective measures. Figure")
303
House of Quality Figure 3.12

304
Series of QFD Houses A-1 A-2 A-3 A-4 House of quality Parts deployment
Customer requirements House of quality Product characteristics A-1 Parts deployment Part characteristics A-2 Process planning Process characteristics A-3 Operating requirements Operations A-4 Figure 3.13

305
Benefits of QFD Promotes better understanding of customer demands
Promotes better understanding of design interactions Involves manufacturing in the design process Breaks down barriers between functions and departments Provides documentation of the design process

306
Robust Design Product can fail due to poor design quality
Products subjected to many conditions Robust design studies Controllable factors - under designer’s control Uncontrollable factors - from user or environment Designs products for consistent performance

307
Place and importance of Transport in the SCM process
Course by J.PONS Place and importance of Transport in the SCM process To Accompany Russell and Taylor, Operations Management, 4th Edition, 2003 Prentice-Hall, Inc. All rights reserved.

308
Supply Chain Mangement business logistics
Area of management that absorbs 30 % of the € sales (cost reducers) Essential element to meeting the customer service goals ( Fulfillment rate)
 Essential element to meeting the customer service goals. ( Fulfillment rate)")
309
SCM Total logistics activities make up 15% of finished product costs broke down as follows : Upstream logistics : % Production logistics : % Downstream logistics : %

310
SCM Transport costs : % Storage costs (financial, handling, insurance, loss& profit) : ,3 % Personal costs : % Warehousing (Premises) : % Material costs : ,7 %
 : 41,3 % Personal costs : 19 % Warehousing (Premises) : 5 % Material costs : 0,7 %")
311
Business Logistics defined Transportation & inventory
Transportation and inventories are the primary cost-absorbing logistics activities They represent together one-half or two-thirds of the total logistics costs. Transportation add « place » value to products and services Inventories add «time» value.

312
Business Logistics Transportation & inventory
Without transportation (because of strike for instance), markets cannot be served and products back up in the pipe line to detoriate or become obsolete. Inventories are essential to logistics management because it is usually not possible or practical to provide instant production or certain delivery times to customers. Inventories serve as buffers between supply and demand so that needed product availability may be maintened for customers while providing flexibility for production
, markets cannot be served and products back up in the pipe line to detoriate or become obsolete. Inventories are essential to logistics management because it is usually not possible or practical to provide instant production or certain delivery times to customers. Inventories serve as buffers between supply and demand so that needed product availability may be maintened for customers while providing flexibility for production.")
313
Key activities customer service standards
Key activities (in every logistics channels) Customer service standards : cooperate with marketing to Determine customer needs and wants for logistics customer service Determine customer response to service (ECR) Set customer service levels
 Customer service standards : cooperate with marketing to. Determine customer needs and wants for logistics customer service. Determine customer response to service (ECR) Set customer service levels.")
314
Business Logistics defined scope and content
Customer service standards set the level of output and degree of readiness to which the logistics system must respond Logistics costs increase in proportion to the level of customer service provided

315
Actors in the carriage chain
Brokers Forwarders Customs brokers Carriers 3PL, 4PL, 5PL, LLP

316
3 PL european Top-ten EXEL 2,5 Md €/7 2 310 000 qm
TNT Post Groep 1,562 Md €/ 3, qm HAYS pic ,5 Md €/ qm TIBETT&BRITTEN 1,2 Md €/ 2,4 NC Christian Salvesen 1,150 Md €/id NC DANZAS Solution 1,114 Md € / 8, m2 FIEGE ,080 Md €/1,2 NC GEODIS ,799 Md €/1, m2 TDG Logistics 0,686 Md €/ id m2 Frigoscandia 0,560 Md €/id m2

317
Physical & financial flows
Insured Beneficiary Seller Consignor Broker Agent advising confirming B. Forwarder Insurance Co Incoterms issuing B. ICC Carrier Insurance LC Sales Carriage Contract Stand By contract contract ILU covers UCP Den Haag, New York CMR, CIM, Vienna Warsaw, Brussels Insured Applicant Buyer Consignee

318
SCM Interfaces between physical & financial flows Carriage contract
Sales contract Letter of credit, C.A.D, SBLC Insurance contract

319
Carriage contract Carriage contract CMR or Geneva Convention (1956)
CIM or Bern Convention (1890) Warsaw (1929) & Protocol n°4 Brussels (1924) , Visby (1968) , French law (1966),Hamburg Convention(1970) Budapest Convention(2000) (french) domestic contracts
 Warsaw (1929) & Protocol n°4. Brussels (1924) , Visby (1968) , French law (1966),Hamburg Convention(1970) Budapest Convention(2000) (french) domestic contracts.")
320
Limitation of liability
Conventions CMR Geneva (1956) CIM Bern (1890) Warsaw (1929) Montreal Protocol Brussels (1924) French Law1966 Hamburg rules 1977 Budapest < 3 tonnes 1998 > 3 tonnes 1999 Repair Limits 8,33 SDR/Kg 17 SDR/Kg 250 Golden French Franc Poincaré 100 golden £/package 2 SDR/Kg ou 666,67 SDR/package 2,5 SDR/Kg ou 875 SDR/package 2 SDR/kg 23 €/Kg max 750 €/package 14 €/Kg max € x total weight
 CIM Bern (1890) Warsaw (1929) Montreal Protocol. Brussels (1924) French Law1966. Hamburg rules Budapest. < 3 tonnes > 3 tonnes Repair Limits. 8,33 SDR/Kg. 17 SDR/Kg. 250 Golden French Franc Poincaré. 100 golden £/package. 2 SDR/Kg ou 666,67 SDR/package. 2,5 SDR/Kg ou 875 SDR/package. 2 SDR/kg. 23 €/Kg max 750 €/package. 14 €/Kg max € x total weight.")
321
Sale’s contract Sale’s contract
NY Convention and arbitration clause (1958) Vienna or UN Convention (1980) Incoterms ICC 2000 Interfaces with carriage contracts : examples Freight collect and prepaid Delivery time
 Vienna or UN Convention (1980) Incoterms ICC Interfaces with carriage contracts : examples. Freight collect and prepaid. Delivery time.")
322
Sale contract Sale contract and latin right
Penitus extranei : fully allien Specialia generalibus derogant : particular provisions are superior to general rules Dura lex, sed lex : law is hard, but it’s law Nemo censitur ignorare legem : nobody is supposed to ignore the law

323
Documentary credit Letter of credit (UCP 500) Main Actors
Applicant (50) Issuing Bank (31 C) Advising and confirming Bank, Beneficiary Documentary chain Letter of credit and logistics instructions
 Issuing Bank (31 C) Advising and confirming Bank, Beneficiary. Documentary chain. Letter of credit and logistics instructions.")
324
Documentary credit Date of maturity or expiry (31 D)
Payment at sight, deferred, (42 P) by acceptation, by negociation Irrevocable (40 A) Period of presentation : 15 days instead of 21 (48) Details of charges (71 B)
 by acceptation, by negociation. Irrevocable (40 A) Period of presentation : 15 days instead of 21 (48) Details of charges (71 B)")
325
Documentary credit Documents Certificate of weight (5)
Shipment advice (6) Certificates that the carrying ship can enter U.A.E seaports (7), is ISM compliant (8), classified (10) Commercial Invoice (46) Certificate of origin (46 A 3) Packing List (46 A 4) B/L
 Certificates that the carrying ship can enter U.A.E seaports (7), is ISM compliant (8), classified (10) Commercial Invoice (46) Certificate of origin (46 A 3) Packing List (46 A 4) B/L.")
326
Documentary credit Letter of credit & logistics instructions
Shipment on a conference vessel (47 A II) On a vessel which is not over 15 years of age Classified as per institute classification clause Partial shipment not allowed (43 P) Loading on board in France (44 A) Latest date of shipment (44 C)
 On a vessel which is not over 15 years of age. Classified as per institute classification clause. Partial shipment not allowed (43 P) Loading on board in France (44 A) Latest date of shipment (44 C)")
327
Goods Insurance Insurance contract
Actors : insured, underwriters, Cies, brokers, agents ILU and ABC covers, WRCC Forclusion General average Interfaces with 3PL Third shipper policies Goods insurance & SDI

328
Construction of a physical chain
Architecture of the physical chain The architect : the Freight forwarder The commissionned broker The carrier

329
Freightforwarder & Broker
Legislation : art ex 94 à 99 (L to L C of C) Comparison with forwarder,Spediteur,… Presomption of Liability Result obligation Way & Means obligations Advise obligation limitations of liability Retention right Time limitation (1 year) Broker Legislation : art 1992 to 1996 of Civil Code. Liability of a «good familly father » Onus of proof Means obligation Commissionned company Advised obligation limitations of liability Lien Prescription or Time limitation (10 years)
 Comparison with forwarder,Spediteur,… Presomption of Liability. Result obligation. Way & Means obligations. Advise obligation. limitations of liability. Retention right. Time limitation (1 year) Broker. Legislation : art 1992 to 1996 of Civil Code. Liability of a «good familly father » Onus of proof. Means obligation. Commissionned company. Advised obligation. limitations of liability. Lien. Prescription or Time limitation (10 years)")
330
Supply Chain Management
Chapter 7 Supply Chain Management To Accompany Russell and Taylor, Operations Management, 4th Edition, 2003 Prentice-Hall, Inc. All rights reserved.

331
Supply Chain All activities associated with the flow and transformation of goods and services from raw materials stage to the end user (the customer), as well as the associated information flows A sequence of business activities from suppliers through customers that provide the products, services, and information to achieve customer satisfaction
, as well as the associated information flows. A sequence of business activities from suppliers through customers that provide the products, services, and information to achieve customer satisfaction.")
332
Supply Chain Example Information Cash Customers Suppliers Producers
Inventory Materials, parts, sub-assemblies, and services Producers Finished goods, end products and services Inventory Distributors Package and delivery Inventory Customers Total satisfaction with quality, price, delivery, and service Products and Services Products and Services Products and Services Cash Figure 7.1

333
Supply Chain Management
Synchronization of activities required to achieve maximum competitive benefits while lowering cost Coordination, cooperation, and communication Rapid flow of information Customer and supplier have the same goals Trust Share in the design of the supply chain Vertical integration

334
Supply Chain Uncertainty
Contributors to variability demand forecasts lead time variability batch ordering price fluctuations inflated orders Inventory is a form of insurance Distorted information is one of the main causes of uncertainty Bullwhip effect

335
Bullwhip Effect = Ordering information Tier 2 Suppliers Tier 1
Producer Distributor Customers Ordering information Amount of inventory =

336
Demand Distortion along the Supply Chain

337
Improving the Supply Chain Through IT
Centralized coordination of information flows Integration of transportation, distribution, ordering, and production Direct access to domestic and global transportation and distribution channels Locating and tracking the movement of every item in the supply chain

338
Improving the Supply Chain Through IT
Consolidation of purchasing from all suppliers Intercompany and intracompany information access Data interchange Data acquisition at the point of origin and point of sale Instantaneous updating of inventory levels

339
Electronic Business (E-Commerce)
Replacement of physical processes with electronic ones Cost and price reductions Reduction or elimination of intermediaries, thus reducing costs Shortening transaction times for ordering and delivery Wider presence and increased visibility

340
Electronic Business (E-Commerce)
Greater choices and more information for customers Improved service Collection and analysis of customer data and preferences Virtual companies with lower prices Leveling the playing field for smaller companies Gain global access to markets & customers

341
Table 7.1 Supply Chain Evolution at Nabisco

342
Electronic Data Interchange (EDI)
Computer-to-computer exchange of business documents in a standard format Quick access, better customer service, less paperwork, better communication, increased productivity, improved tracing and expediting, improves billing and cost efficiency Effective in eliminating the bullwhip effect

343
Bar Codes Computer readable codes attached to items flowing through the supply chain Generates point-of-sale data which is useful for determining sales trends, ordering, production scheduling, and deliver plans

344
The Internet Instant global access to organizations, individuals, and information sources Fundamentally changes the way organizations do business Removes geographic barriers Shifts the advantage in the transaction process from the seller to the buyer Adds speed and accessibility to the supply chain

345
Figure 7.2 Build-to-Order Cars over the Internet

346
The E-Automotive Supply Chain
SUPPLY CHAIN PROCESS AUTOMOTIVE PAST E-AUTOMOTIVE Customer sales Push—sell from inventory Pull—Build-to-order Production Goal of even and stable production Focus on customer demand, respond with supply chain flexibility Distribution Mass approach Fast, reliable, and customized to get cars to specific customer location Customer relationships Dealer-owned Shared by dealers and manufacturers Managing uncertainty Large car inventory at dealers Small inventories with shared information and strategically placed parts inventories Procurement Batch-oriented; dealers order based on allocations Orders made in real time based on available-to-promise information Product design Complex products don’t match customer needs Simplified products based on better information about what customers want Table 7.2

347
Intranets and Extranets
Intranets are internet-like networks that operate within a single organization Extranets are intranets that can be connected to the global internet Difference is in who has access to the system

348
IT Issues Increased benefits and sophistication come with increased costs Efficient web sites do not necessarily mean the rest of the supply chain will be as efficient Security problems are very real Partnership and trust are important elements that may be new to business relationships

349
Suppliers Purchased materials account for about half of manufacturing costs Materials, parts, and service must be delivered on time, of high quality, and low cost Suppliers should be integrated into their customers’ supply chains Partnerships should be established

350
Suppliers On-demand (direct response) delivery is a frequent requirement to support just-in-time (JIT) inventory system In continuous replenishment, a company shares real-time demand and inventory data

351
Sourcing Sourcing is the selection of suppliers
Relationship between customers and suppliers focuses on collaboration and cooperation Outsourcing has become a long-term strategic decision Organizations focus on core competencies Single-sourcing is increasingly a part of supplier relations

352
E-Procurement Business-to-business commerce conducted on the Internet
Benefits include lower transaction costs, lower prices, reduce clerical labor costs, and faster ordering and delivery times Currently used more for indirect goods E-Marketplaces service industry-specific companies and suppliers

353
Figure 7.3 The Wal-Mart Supply Chain

354
Figure 7.4 Centralized Supply at Honda America

355
Distribution (Logistics)
The actual movement of products and materials between locations Order fulfillment is ensuring on-time delivery of the customer’s order Handling of materials and products at receiving docks, storing products, packaging, and shipping

356
Distribution (Logistics)
Driving force today is speed Particularly important for Internet dot-coms (virtual companies)
")
357
Figure 7.5 Order Fulfillment at Amazon.com

358
Distribution Centers and Warehousing
DCs are some of the largest business facilities in the United States Trend is for more frequent orders in smaller quantities Flow-through facilities and automated material handling Final assembly and product configuration may be done at the DC

359
Warehouse Management Systems
Highly automated systems Controls item putaway, picking, packing, and shipping Transportation management Track inbound and outbound shipments Consolidate and build economical loads Select the best carrier

360
Warehouse Management Systems
Order management Add, modify, or cancel orders in real time Yard management Controls activities at the facility’s dock Schedules dock appointments Labor management Plans, manages, and reports performance level of personnel

361
Warehouse Management Systems
Warehouse optimization Optimizes placement of items in the warehouse (slotting) based on demand, product grouping, and the physical characteristic s of the item Creates custom labeling and packaging Facilitates cross-docking
 based on demand, product grouping, and the physical characteristic s of the item. Creates custom labeling and packaging. Facilitates cross-docking.")
362
Figure 7.6 A WMS

363
Vendor-Managed Inventory (VMI)
Manufacturers generate orders, not distributors Stocking information is accessed using EDI A first step towards supply chain collaboration Increased speed, reduced errors, and improved service

364
Collaborative Planning, Forecasting, and Replenishment (CPFR)
Web-based standard that enhances VMI Continuous replenishment through joint forecasting through the exchange of data and information Reduces bullwhip effect Significant decrease in inventory levels and more efficient logistics

365
Marketing Achats Services de Mktg Mktg l’entreprise vente Achats
Le marketing achats consiste à assurer à l’entreprise la pérennité des sources et des produits en vérifiant par anticipation l’adéquation des besoins de l’entreprise et du marché. Le marketing vente fait fabriquer ce qui pourra se vendre. Les services internes font acheter ce dont ils ont besoin pour produire ce que les vendeurs espèrent vendre. Le marketing achats fait connaître ce qu’on peut trouver sur le marché en q, Q, t Services de l’entreprise Mktg vente Mktg Achats

366
SRM ou Supplier Relationship Management
Introduit début par I2 Technologies RFI : request for information RFQ : request for quotation Etape 1 Design collaboratif : qualité équivalente avec nombre de pièces réduites Etape 2 sourcing : identification, qualification (taille critique, capacité à livrer dans les temps, emplacement géographique), short list Etape n°3 négociation Etape n°4 approvisionnement : (logistique, modalités de paiement). Etape n°5 récurrente : évaluation des performances
, short list. Etape n°3 négociation. Etape n°4 approvisionnement : (logistique, modalités de paiement). Etape n°5 récurrente : évaluation des performances.")
367
SRM & e-procurement Gains de productivité et optimisation de la relation avec les fournisseurs (SRM) Outils du e-procurement pour achats hors-production : catalogues en ligne et commande selon un circuit de validation (workflow) Entre 5 et 10% de gains pour un ROI de 18 mois.
 Entre 5 et 10% de gains pour un ROI de 18 mois.")
368
SRM & e-procurement Hubwoo.com, compatible avec SAP.(choisi par Saint Gobain) mySAP SRM : solution SAP qui gère tout le cycle de la relation fournisseur, des fonctions stratégiques aux fonctions opérationnelles. SAP : plate-forme collaborative interagissant entre outils SCM (logistique), PLM (conception) et ERP (relation transactionnelle).
, PLM (conception) et ERP (relation transactionnelle).")
369
GPA Intermarché M Bruno BORDE : Dr du projet EDI/ECR chez Les Mousquetaires 6 ans pour atteindre 90% des commandes en EDI Envisagé au départ pour améliorer livraisons de produits frais sur points de vente Coûts élevés : traducteur, machine, adhésion à RVA : gros fournisseurs Pour les 1000 petits fournisseurs Web-EDI « Gpiste », nouveau métier, différent de l’ADV car il faut avoir une vision sur les stocks et les rotations des distributeurs, savoir réagir à des données extérieures (météo…) Les lacunes de la GPA ont généré les besoins en CPFR A l’origine, les USA avaient prévu la GPA sans promotion, ce qui n’est pas conforme à nos pratiques
 Les lacunes de la GPA ont généré les besoins en CPFR. A l’origine, les USA avaient prévu la GPA sans promotion, ce qui n’est pas conforme à nos pratiques.")
370
SCM III.a) Logistique stratégique
 Logistique stratégique")
371
CE2M (automotive sector) Approche logistique sectorielle
Les 7 « Zéros » de Shigeo Shingo ou vers l’excellence logistique Positionnement idoine de la fonction logistique Interfaces fonctionnelles et ERP Interfaces opérationnelles Interfaces sectorielles

372
Excellence logistique
O Stock Right Inventory

373
Les Modules R/3 de SAP : Contrôle de Gestion (CO)
• CO gère le contrôle des coûts et des produits d’ une entreprise • Ses principales composantes sont : – Comptabilité analytique des natures comptables – Comptabilité analytique des centres de coûts – Comptabilité analytique des supports de coûts – Comptabilité analytique des projets – Compte de résultats – Comptabilité analytique des centres de profit – Méthode des coûts de l ’ activité – Contrôle de gestion de l ’ entreprise

374
Les Modules R/3 de SAP : Gestion des Immobilisation (AM)
• Il est conçu pour la gestion et le suivi des différents aspects de l ’ actif immobilisé. • Ses principales composantes sont : – Gestion des immobilisation technique et de la maintenance • Entretien • Remise en état – Suivi de investissements • Cession d ’ immobilisations • Comptabilité des immobilisations – Amortissement • Gestion des investissements

375
Les Modules R/3 de SAP : Comptabilité Financière (FI)
• Ce module est conçu pour la gestion automatique des comptes généraux et le reporting externe pour la comptabilité clients, la comptabilité fournisseur, ainsi que pour d ’autre compte de tiers, à l ’ aide d ’ un plan comptable personnalisé. • Ses principales composantes sont : – Comptabilité générale – Comptabilité fournisseurs – Comptabilité clients – Gestion de trésorerie – Consolidation – Système d ’ information de la comptabilité.

376
Excellence logistique
Zéro Défaut Flawless

377
Integrators FedEx UPS Created in 1919 Created in 1973
3,3 millions parcels/day towards 210 countries employees warehouses &10 hubs 649 planes vehicules Turn over 22 M$ in 2002 Network : Memphis, Subic Bay, Dubaï, Paris. UPS Created in 1919 11,5 millions parcels/day towards 200 countries employees 1713 warehouses & 15 hubs 584 planes vehicules Turn over 31,3 M$ Network in Europe: Köln, Bonn

378
Integrators DHL TNT 40 000 employees 8 hubs in the world
Created in 1970 228 countries employees 3002 agences et 35 hubs Brussels in Europe 252 planes vehicules EDI Connection Turn over : 6,2 m$ TNT employees 8 hubs in the world (Liege in Europe) 43 planes vehicules Turn over : 11,78 m$
 43 planes vehicules. Turn over : 11,78 m$")
379
Aircraft Companies Intern’l traffic Lufthansa (6,5 MTK)
Korean Air ways (5,7) Singapore AL (5,4) AF (4,7) BA JAL FedEx KLM Cathay Pacific United A Northwest Nippon Cargo UPS (15) National traffic FedEx (6,054) UPS (4 232) United A (0,958) Northwest A (0,765) AA Delta A L ANA China Southern A Varig Air Canada China Eastern A Total traffic FedEx (10 069) Lufthansa (6 603) UPS (5,9) Korean A (5,8) Singapore A (5,4) Cathay Northwest A
 Singapore AL (5,4) AF (4,7) BA. JAL. FedEx. KLM. Cathay Pacific. United A. Northwest. Nippon Cargo. UPS (15) National traffic. FedEx (6,054) UPS (4 232) United A (0,958) Northwest A (0,765) AA. Delta A L. ANA. China Southern A. Varig. Air Canada. China Eastern A. Total traffic. FedEx (10 069) Lufthansa (6 603) UPS (5,9) Korean A (5,8) Singapore A (5,4) Cathay. Northwest A.")
380
Intégrateurs US et banane bleue

381
Le diagramme Causes-Effet : "ISHIKAWA"
Le diagramme Causes-effet est un support graphique : De discussion en servant de guide, de fil conducteur De formation en capitalisant l’expérience de chacun De présentation en formalisant le savoir faire de chacun Matière Main d’œuvre EFFET Méthodes Matériel Milieu

382
Les Modules R/3 de SAP : Management de la Qualité (QM)
• QM est un système de contrôle et d ’ information permettant de gérer la planification, le suivi, ainsi que la maitrise de la qualité dans le domaine de la production, des coûts et de l ’ approvisionnement. • Principales composantes du module QM – Contrôle qualité – Planification de la qualité – Système d ’ information de management de la qualité (SIMQ)
")
383
"Les 5 S" SEITON : Rangement SEISO : Nettoyage SEIKETSU : Ordre
SEIRI : Débarras SEITON : Rangement SEISO : Nettoyage SEIKETSU : Ordre SHITSUKE : Rigueur Objectif : améliorer les conditions de travail et instaurer un esprit de rigueur. Le rangement et la propreté sont les premières étapes de la qualité, et une action forte dans ce sens donne des résultats spectaculaires : Débarrasser, c'est aussi faire ressortir de leurs "cachettes" les produits "en attente" à rebuter ou à réparer, et à cette occasion se poser la question : Comment se fait il que nous ayons produit cela ? Ranger, c'est aussi repartir du bon pied, marquer un changement Nettoyer, et donner envie de garder ensuite dans le même état Ordre : chaque chose à sa place, une place pour chaque chose, disaient les anciens Rigueur, par l'implication et la mesure du suivi Méthode Stock Express : Journée propreté, à l'occasion d'une baisse de charge, et de préférence sur une décision "plus ou moins dirigée" du CHSCT dans un objectif d'amélioration de la sécurité et des conditions de travail Réalisation d'une planche de photos, prises dans tous les secteurs de l'entreprise (ne pas oublier les bureaux) qui servira ensuite de référentiel Définition d'un système de cotation : par service avec des points négatifs sur un capital de départ Création d'un groupe 5S, composé d'un représentant de la direction, de la qualité et du CHSCT, qui, à intervalles définis, effectue un audit 5S dans toute l'entreprise, et évalue par rapport au référentiel (notamment la planche photos) Publication par affichage des résultats de chaque audit, et classement annuel par cumul Prix 5S
 qui servira ensuite de référentiel. Définition d un système de cotation : par service avec des points négatifs sur un capital de départ. Création d un groupe 5S, composé d un représentant de la direction, de la qualité et du CHSCT, qui, à intervalles définis, effectue un audit 5S dans toute l entreprise, et évalue par rapport au référentiel (notamment la planche photos) Publication par affichage des résultats de chaque audit, et classement annuel par cumul. Prix 5S.")
384
KAIZEN Tenir sa maison en ordre Seiri (trier, to sort)
Seiton (ranger, to straighten) Seiso (nettoyer, to scrub) Seiketsu (systématiser, to systematize) Shitsuke (standardiser, to standardize)
 Seiso (nettoyer, to scrub) Seiketsu (systématiser, to systematize) Shitsuke (standardiser, to standardize)")
385
P.D.C.A

386
Les outils qualité

387
Gemba KAIZEN Lutter contre les 7 gaspillages (Muda)
Muda de surproduction (production par avance crée stocks) Muda de stockage (pièces stockées ne créent pas de VA) Muda de rejets (pièces défectueuses coûteuses) Muda de mouvement (optimisation des postes de travail) Muda de traitements superflus (élimination de tâches) Muda d’attente (opérateur inoccupé, muda de Main d’Oeuvre) Muda de transport (move time)
 Muda de stockage (pièces stockées ne créent pas de VA) Muda de rejets (pièces défectueuses coûteuses) Muda de mouvement (optimisation des postes de travail) Muda de traitements superflus (élimination de tâches) Muda d’attente (opérateur inoccupé, muda de Main d’Oeuvre) Muda de transport (move time)")
388
"L'A.M.D.E.C." Analyse des Modes de Défaillances, de leur Effets et de leurs Criticités Analyse préventive, en conception généralement AMDEC produit, AMDEC processus Objectif : Identifier les risques de non qualité pour le client, l'utilisateur… ou l'actionnaire Adapter les actions aux risques encourus Objectif : améliorer les conditions de travail et instaurer un esprit de rigueur. Le rangement et la propreté sont les premières étapes de la qualité, et une action forte dans ce sens donne des résultats spectaculaires : Débarrasser, c'est aussi faire ressortir de leurs "cachettes" les produits "en attente" à rebuter ou à réparer, et à cette occasion se poser la question : Comment se fait il que nous ayons produit cela ? Ranger, c'est aussi repartir du bon pied, marquer un changement Nettoyer, et donner envie de garder ensuite dans le même état Ordre : chaque chose à sa place, une place pour chaque chose, disaient les anciens Rigueur, par l'implication et la mesure du suivi Méthode Stock Express : Journée propreté, à l'occasion d'une baisse de charge, et de préférence sur une décision "plus ou moins dirigée" du CHSCT dans un objectif d'amélioration de la sécurité et des conditions de travail Réalisation d'une planche de photos, prises dans tous les secteurs de l'entreprise (ne pas oublier les bureaux) qui servira ensuite de référentiel Définition d'un système de cotation : par service avec des points négatifs sur un capital de départ Création d'un groupe 5S, composé d'un représentant de la direction, de la qualité et du CHSCT, qui, à intervalles définis, effectue un audit 5S dans toute l'entreprise, et évalue par rapport au référentiel (notamment la planche photos) Publication par affichage des résultats de chaque audit, et classement annuel par cumul Prix 5S
 qui servira ensuite de référentiel. Définition d un système de cotation : par service avec des points négatifs sur un capital de départ. Création d un groupe 5S, composé d un représentant de la direction, de la qualité et du CHSCT, qui, à intervalles définis, effectue un audit 5S dans toute l entreprise, et évalue par rapport au référentiel (notamment la planche photos) Publication par affichage des résultats de chaque audit, et classement annuel par cumul. Prix 5S.")
389
"L'A.M.D.E.C." C = D x O x S C = Criticité
Analyse des Modes de Défaillances, de leur Effets et de leurs Criticités C = D x O x S C = Criticité D = probabilité de non détection O = occurrence S = gravité Objectif : améliorer les conditions de travail et instaurer un esprit de rigueur. Le rangement et la propreté sont les premières étapes de la qualité, et une action forte dans ce sens donne des résultats spectaculaires : Débarrasser, c'est aussi faire ressortir de leurs "cachettes" les produits "en attente" à rebuter ou à réparer, et à cette occasion se poser la question : Comment se fait il que nous ayons produit cela ? Ranger, c'est aussi repartir du bon pied, marquer un changement Nettoyer, et donner envie de garder ensuite dans le même état Ordre : chaque chose à sa place, une place pour chaque chose, disaient les anciens Rigueur, par l'implication et la mesure du suivi Méthode Stock Express : Journée propreté, à l'occasion d'une baisse de charge, et de préférence sur une décision "plus ou moins dirigée" du CHSCT dans un objectif d'amélioration de la sécurité et des conditions de travail Réalisation d'une planche de photos, prises dans tous les secteurs de l'entreprise (ne pas oublier les bureaux) qui servira ensuite de référentiel Définition d'un système de cotation : par service avec des points négatifs sur un capital de départ Création d'un groupe 5S, composé d'un représentant de la direction, de la qualité et du CHSCT, qui, à intervalles définis, effectue un audit 5S dans toute l'entreprise, et évalue par rapport au référentiel (notamment la planche photos) Publication par affichage des résultats de chaque audit, et classement annuel par cumul Prix 5S
 qui servira ensuite de référentiel. Définition d un système de cotation : par service avec des points négatifs sur un capital de départ. Création d un groupe 5S, composé d un représentant de la direction, de la qualité et du CHSCT, qui, à intervalles définis, effectue un audit 5S dans toute l entreprise, et évalue par rapport au référentiel (notamment la planche photos) Publication par affichage des résultats de chaque audit, et classement annuel par cumul. Prix 5S.")
390
"L'A.M.D.E.C." Analyse des Modes de Défaillances, de leur Effets et de leurs Criticités Méthode : Création d'un groupe de travail (multidisciplinaire) Définition des critères d'évaluation pour les facteurs D, O, S Echelle de notation de 1 à 10 Décomposition fonctionnelle Actions préventives Evaluation après mise en place de l'action Objectif : améliorer les conditions de travail et instaurer un esprit de rigueur. Le rangement et la propreté sont les premières étapes de la qualité, et une action forte dans ce sens donne des résultats spectaculaires : Débarrasser, c'est aussi faire ressortir de leurs "cachettes" les produits "en attente" à rebuter ou à réparer, et à cette occasion se poser la question : Comment se fait il que nous ayons produit cela ? Ranger, c'est aussi repartir du bon pied, marquer un changement Nettoyer, et donner envie de garder ensuite dans le même état Ordre : chaque chose à sa place, une place pour chaque chose, disaient les anciens Rigueur, par l'implication et la mesure du suivi Méthode Stock Express : Journée propreté, à l'occasion d'une baisse de charge, et de préférence sur une décision "plus ou moins dirigée" du CHSCT dans un objectif d'amélioration de la sécurité et des conditions de travail Réalisation d'une planche de photos, prises dans tous les secteurs de l'entreprise (ne pas oublier les bureaux) qui servira ensuite de référentiel Définition d'un système de cotation : par service avec des points négatifs sur un capital de départ Création d'un groupe 5S, composé d'un représentant de la direction, de la qualité et du CHSCT, qui, à intervalles définis, effectue un audit 5S dans toute l'entreprise, et évalue par rapport au référentiel (notamment la planche photos) Publication par affichage des résultats de chaque audit, et classement annuel par cumul Prix 5S
 Définition des critères d évaluation pour les facteurs D, O, S. Echelle de notation de 1 à 10. Décomposition fonctionnelle. Actions préventives. Evaluation après mise en place de l action. Objectif : améliorer les conditions de travail et instaurer un esprit de rigueur. Le rangement et la propreté sont les premières étapes de la qualité, et une action forte dans ce sens donne des résultats spectaculaires : Débarrasser, c est aussi faire ressortir de leurs cachettes les produits en attente à rebuter ou à réparer, et à cette occasion se poser la question : Comment se fait il que nous ayons produit cela Ranger, c est aussi repartir du bon pied, marquer un changement. Nettoyer, et donner envie de garder ensuite dans le même état. Ordre : chaque chose à sa place, une place pour chaque chose, disaient les anciens. Rigueur, par l implication et la mesure du suivi. Méthode Stock Express : Journée propreté, à l occasion d une baisse de charge, et de préférence sur une décision plus ou moins dirigée du CHSCT dans un objectif d amélioration de la sécurité et des conditions de travail. Réalisation d une planche de photos, prises dans tous les secteurs de l entreprise (ne pas oublier les bureaux) qui servira ensuite de référentiel. Définition d un système de cotation : par service avec des points négatifs sur un capital de départ. Création d un groupe 5S, composé d un représentant de la direction, de la qualité et du CHSCT, qui, à intervalles définis, effectue un audit 5S dans toute l entreprise, et évalue par rapport au référentiel (notamment la planche photos) Publication par affichage des résultats de chaque audit, et classement annuel par cumul. Prix 5S.")
391
"Le Chantier HOSHIN" Objectif : Principaux acteurs : Point négatif :
Améliorer l’organisation du travail, les installations et les flux de production Principaux acteurs : Fabrication, Etudes/Méthodes, Ressources humaines Point négatif : Non responsabilisation des opérateurs impliqués dans le chantier HOSHIN

392
Objectifs et Avantages :
"Le Chantier HOSHIN" Méthode : Sélection du chantier et constitution du groupe Analyse et élaboration des propositions d’amélioration et de la nouvelle implantation Réalisation des travaux d’aménagement Mise en place des modifications de processus et/ou des actions d'amélioration Validation du process – Evaluation du résultat Objectifs et Avantages : Chasser tout gaspillage Éliminer les temps d’attente Optimiser la manutention Motiver les collaborateurs

393
Le diagramme Causes-Effet : "ISHIKAWA"
OBJECTIF : Déterminer toutes les causes possibles d’un problème pour trouver les causes les plus probables PRINCIPE : 1. Définir clairement l’effet dont on cherche les causes 2. Tracer le diagramme avec les familles : les 5 M (Milieu, Main d’œuvre, Méthode, Matière, Matériel) 3. Rechercher en séance de brainstorming toutes les causes possibles et les classer dans les différentes familles choisies. REMARQUE : Le diagramme "ISHIKAWA" est un outil très utilisé dans le cadre d'une démarche "A.M.D.E.C"
 3. Rechercher en séance de brainstorming toutes les causes possibles et les classer dans les différentes familles choisies. REMARQUE : Le diagramme ISHIKAWA est un outil très utilisé dans le cadre d une démarche A.M.D.E.C")
394
Excellence Logistique
0 papier

395
Les Modules R/3 de SAP : WorkFlow (WF)
• Ce module assure la liaison entre les modules R/3 de SAP intégrés et les technologies, outils et services inter-application (EAI) • WF permet le lancement automatique des processus de gestion, selon des règles et des procédures prédéfinies. – Le gestionnaire de Workflow crée un « work item » chaque fois que des événements lancent un processus de gestion – La logique d ’ exécution permet au Workflow d ’ incorporer à chaque étape des données, ainsi que des documents. – Les règles de traitement définies permettent au gestionnaire de Workflow d ’ acheminer le « work item » crée au rôle approprié (emplacement, personne ou unité) • WF peut être lancé automatiquement via des données ou des exeptions
 • WF permet le lancement automatique des processus de gestion, selon des règles et des procédures prédéfinies. – Le gestionnaire de Workflow crée un « work item » chaque. fois que des événements lancent un processus de gestion. – La logique d ’ exécution permet au Workflow d ’ incorporer. à chaque étape des données, ainsi que des documents. – Les règles de traitement définies permettent au gestionnaire. de Workflow d ’ acheminer le « work item » crée au rôle. approprié (emplacement, personne ou unité) • WF peut être lancé automatiquement via des données. ou des exeptions.")
396
En japonais : Etiquette
"KANBAN" En japonais : Etiquette Objectifs : Réduire les coûts de production Améliorer la qualité des produits Répondre plus rapidement aux besoins des clients Principe : Supprimer tout ce qui n'ajoute pas de valeur au produit ! Stocks de matières premières Stocks d'encours de production Temps de changements d'outils (S.M.E.D) Nombre de fournisseurs Plus familier sous le terme "juste à temps". En réalité, Kanban est le nom que TOYOTA a donné à son système de juste à temps La suppression des stocks est un facteur de profitabilité, car réduit de façon conséquente les frais financiers de l'entreprise Notion de "coût de possession", incluant les frais financiers, mais aussi les moyens spécifiques dédiés (locaux, équipements, personnel, etc…) Importance de la fonction "ordonnancement" Notion de "flux tirés"
 Nombre de fournisseurs. Plus familier sous le terme juste à temps . En réalité, Kanban est le nom que TOYOTA a donné à son système de juste à temps. La suppression des stocks est un facteur de profitabilité, car réduit de façon conséquente les frais financiers de l entreprise. Notion de coût de possession , incluant les frais financiers, mais aussi les moyens spécifiques dédiés (locaux, équipements, personnel, etc…) Importance de la fonction ordonnancement Notion de flux tirés")
397
Excellence Logistique
O panne et 0 incident

398
Excellence Logistique
O Mépris

399
Les Modules R/3 de SAP : Gestion du Personnel (HR)
• HR es un système intégré qui permet de gérer la planification et le contrôle des activités du personnel • Ses principales composantes sont : – Administration du personnel et calcul de paie • Gestion des temps • Calcul des frais de déplacement • Avantages sociaux • Recrutement... – Gestion des carrières et des compétences • Planification de l ’ affectation • Gestion de la formation • Gestion de l ’ organisation • Gestion prévisionnelle du personnel – Système d ’ information de la gestion du personnel

400
Les Modules R/3 de SAP : Gestion de la maintenance (PM)
• PM gère la planification, le traitement et l ’ exécution des tâches liées à la maintenance • Ses principales composantes sont : – Traitement des tâches non planifiées – Gestion des services – Avis de maintenance par date ou compteur – Planification de la maintenance – Nomenclature de maintenance – Système d ’ information de gestion de la maintenance (SIGM)
")
401
Intégration sectorielle de la logistique
Contexte : déstabilisation des modèles logistiques par l’aval et par l’amont Conséquences : comportements nouveaux dans les canaux de distribution Facteurs de changement : Évolution de la concurrence qui se place sur le plan de la vitesse de réponse aux attentes des consommateurs et non plus sur la seule composante prix Sophistication croissante des consommateurs NTIC qui permettent des changemennts structurels importants Coopération entre acteurs considérée comme essentielle

402
Intégration sectorielle de la Logistique
Motivations de la coopération Recherche d’une alternative aux schémas concurrentiels Réduction des coûts de transaction Création de valeur distinctive et unique Gestion de l’incertitude Limitations et problèmes posés par la coopération Dimension comportementale Contrôle et normalisation des relations Modalités de répartition des ressources crées Conséquences organisationelles

403
Logistique aval Les 5 fonctions d’utilité d’un canal de distribution :
Fonction de lieu : lieu de production->lieu de vente Fonction d’assortiment : recomposition de la gamme (co-packing) Fonction de lot : lot de fab-> lot de vente Fonction de transformation : différenciation retardée Fonction de temps : maintenance du produit (respect de la chaîne du froid)
 Fonction de lot : lot de fab-> lot de vente. Fonction de transformation : différenciation retardée. Fonction de temps : maintenance du produit (respect de la chaîne du froid)")
404
Intégration sectorielle de la Logistique
Typologie des canaux de distribution Agents passifs ou actifs / relations conflictuelles ou collaboratives Canal classique: relations ponctuelles des acteurs, pas de volonté de structuration ou de contrôle (ex boulangerie) Canal géré : poids plus important conquis et occupé par un des agents au sein du canal de distribution; pas de négociation, conflits importants (cas de la grande distribution en France). Canal contractualisé : formalisation après négociation préalable (ex distribution automobile jusqu’en 2002 ou Seita) Canal intégré : complètement maîtrisé par un agent du canal de distribution (ex Michelin et réseau Euromaster, Point P ou Benetton)
 Canal géré : poids plus important conquis et occupé par un des agents au sein du canal de distribution; pas de négociation, conflits importants (cas de la grande distribution en France). Canal contractualisé : formalisation après négociation préalable (ex distribution automobile jusqu’en 2002 ou Seita) Canal intégré : complètement maîtrisé par un agent du canal de distribution (ex Michelin et réseau Euromaster, Point P ou Benetton)")
405
Intégration sectorielle de la Logistique
Logistique et canaux de distribution Canal classique: approche désintégrée, pas de recherche de synergie ou de mise en cohérence; chaque acteur dispose de son propre processus logistique indépendant Canal géré : logistique, levier d’administration du canal pour l’un des acteurs (producteur ou distributeur) . Canal contractualisé : logistique concertée Canal intégré : optimisation de l’ensemble de la chaîne de mise à disposition
 . Canal contractualisé : logistique concertée. Canal intégré : optimisation de l’ensemble de la chaîne de mise à disposition.")
406
Les grandes Cies mondiales
Maersk Sealand P&O Nedlloyd Evergreen Hanjin/DSR Senator MSC NOL/APL COSCO NYK CPShips CMA CGM MOL K Line ZIM OOCL, HLloyd, YangMing, ChinaShipping, Hyundai, CSAV, 297 n EVP 138 n EVP 129 n EVP 82 n EVP 138 n EVP 81 n EVP 113 n EVP 86 n EVP 80 n EVP 81 n EVP 65 n EVP 62 n EVP 75 n EVP Source BRS-Alphaliner 2001

407
Les grandes Cies mondiales tout type de vaisseaux (2002)
MOL (J) COSCO (Chine) NYK (J) Fredriksen (Nv) Ofer (Israël) AP Moller (DK) K Line (J) Bergesen (Nv) 384n ,- MTPL Tankers + bulkers+ CTR Ships Source Lloyd’s Maritime Database
 COSCO (Chine) NYK (J) Fredriksen (Nv) Ofer (Israël) AP Moller (DK) K Line (J) Bergesen (Nv) 384n 23,- MTPL. Tankers + bulkers+ CTR Ships. Source Lloyd’s Maritime Database.")
408
Plus grands ports CTR HK Singapore Pusan Kaoshiung RDAM Shanghaï LA LB
Hamburg Anvers Port Klang Doubaî NY Tokyo Felxstove Bremerhaven Giaio Tauro Tanjung Prioc Yokohama 18,098 Millions EVP 17,090 7,540 7,425 6,274

409
Plus grands ports volume cargo
Singapore RDAM South Louisana Shanghaï HK Houston Chiba Nagoya Ulsan Kwangyang Antwerp NY Inchon Pusan Yokohama Kaoshiung Guangzou Quinhuangdao Ningbo Marseille Le Havre (39) Sources AAPA (American association of port Authorities ) 2001
 Sources AAPA (American association of port Authorities )")
410
SCM III.b) Positionnement de la logistique
 Positionnement de la logistique")
411
Strategical Logistics Ideal Position of the logistics function in the organization Chart to take up the challenge of the 7 « R’s »

412
Supply Chain Management
SCM R & D Conception Human Resources Purchasing Suppliers Board Finance Production Plant Quality Logistics Distribution B to B Marketing Client B to C ERP APS Fonctional links Operational links Information links

413
Strategical Logistics MSP : Master Schedule Plan PCZ strategy : (develop New Products, New Consumers, New Zones)
")
414
Approche Logistique fonctionnelle Logistico-Marketing
Influence de la Logistique sur le marketing-mix Variable produit : largeur et profondeur de la gamme, facteur de domination du marché si disponibilité réelle du produit et coûts acceptables. Packaging : composantes marketing et logistique, influe sur le prix de revient, productivité logistique, performance commerciale du produit. Vie du produit : disponibilité de stock, SLI, pièces de rechange.

415
Approche Logistique fonctionnelle Logistico-Marketing
Influence de la Logistique sur le marketing-mix Variable prix : taille de commandes et seuils tarifaires Achats spéculatifs et prix d’activités Incitations quantitatives Niveaux de stocks Lissage de charge difficile

416
Approche Logistique fonctionnelle Logistico-Marketing
Influence de la Logistique sur le marketing-mix Variable promotions initiées par marketing et commercial Effets sur pilotage des flux Accélérateur momentané des ventes Prise en compte par le distributeur du montant de la ristourne, de l’accroissement des stocks, des coûts d’entreposage, de l’obsolescence éventuelle Répercussions pour la logistique : post-manufacturing, copacking, présentoirs, TG, incertitude de la demande…

417
Approche Logistique fonctionnelle Logistico-Marketing
The mission of Logistics is to get : - the right goods or services - to the right place - at the right time - and in the desired condition, - while making the greatest contribution to the firm

418
Contribution of Logistics to the value of the products
Logistics & Marketing Logistics is a key success factor for : Availibility, Timeliness, Delivery in good condition, Responsiveness Time to market = Logistics and 7 "R"s

419
Supply Chain Mangement strategical logistics
Mission of a Logistician To set the level of logistics activities so as to make products and services available to customers : - at the time, place and in the condition and form desired _ in the most profitable or cost-effective way.

420
Business Logistics defined scope and content
Customer service standards set the level of output and degree of readiness to which the logistics system must respond Logistics costs increase in proportion to the level of customer service provided

421
ERP

424
Stratégie Règles d’or d’Oliver WIGHT
Implication de la DG, Maître d’ouvrage Mise en place d’une structure de projet : maîtrise d’œuvre : comité de pilotage mis en place par Comité de Direction, avec un Dr de Projet Mise à niveau des données techniques : fournisseurs, nomenclatures Impliquer et former les utilisateurs : conduite du changement

425
Couple vente production
L’entreprise vit parce qu ’elle vend Le système de production est tiré par la fonction commerciale (et non l’inverse)
")
426
Achats Livraison O.F facturation B.Méthodes Ordo-lancement B.d’Etudes
Stocks Magasins Production O.F Commande client Livraison facturation B.Méthodes Ordo-lancement Boîte noire = Système de production de l’entreprise B.d’Etudes

427
Typologie de production
Référentiel de l’APICS Il faut toujours ramener un modèle à une typologie de production Fabrication sur stock ou sur catalogue : (ATP) ex MGS : vêtements, petits électro-manager Nécessité d’un stock de produits finis Fabrication à la commande (sur mesure): Porte-avion, prototype, petites séries Absence totale de stocks de produits finis Assemblage à la commande : Commande sur stock, Finition à la commande
 ex MGS : vêtements, petits électro-manager. Nécessité d’un stock de produits finis. Fabrication à la commande (sur mesure): Porte-avion, prototype, petites séries. Absence totale de stocks de produits finis. Assemblage à la commande : Commande sur stock, Finition à la commande.")
428
Logistique & OGP Points de découplage et structures logistiques
Fabrication et réapprovisionnement au point de vente Fabrication et réapprovisionnement pour le stock central Assemblage à la commande Fabrication sur commande Fabrication et achats fournisseurs sur commande

429
Logistique & OGP Joseph ORLICKY (1965) , base du MRP2
Besoins indépendants (besoins aléatoires ou externes exprimés par le marché ) ne peuvent être qu’estimés.(PDP) Gestion du point de commande basée sur un concept d’indépendance Besoins dépendants (induits ou internes) doivent être calculés Le réapprovisionnement d’un article donné est fonction de la commande d’autres articles (fabrication de roues dépendante de la fabrication d’une voiture)
 ne peuvent être qu’estimés.(PDP) Gestion du point de commande basée sur un concept d’indépendance. Besoins dépendants (induits ou internes) doivent être calculés. Le réapprovisionnement d’un article donné est fonction de la commande d’autres articles (fabrication de roues dépendante de la fabrication d’une voiture)")
430
Logistique & OGP Nomenclatures : données techniques, (fabriqué, acheté, semi fini, MP,…), délais MRP, ressources, règles de gestion (q exacte, q mn, q multiple), lot technique, stock sécurité, q en stock, rangs Résultats : échéancier
, délais MRP, ressources, règles de gestion (q exacte, q mn, q multiple), lot technique, stock sécurité, q en stock, rangs. Résultats : échéancier.")
431
Pyramide de l’APICS NIVEAU I de l’APICS Plan stratégique
Établi par Comité Directeur composé de la DG, du Dr commercial, Dr industriel, DRH, Logisticien

432
Pyramide de l’APICS NIVEAU II de l’APICS
PIC : Plan Industriel & Commercial (long terme) (production plan) Outil de Direction, basé sur des prévisions de commande Communiqué au Conseil d’Administration et aux Banques Négociation entre les différents responsables de l’entreprise : PIC objectif, puis arrêté Famille produits :ex bagages
 (production plan) Outil de Direction, basé sur des prévisions de commande. Communiqué au Conseil d’Administration et aux Banques. Négociation entre les différents responsables de l’entreprise : PIC objectif, puis arrêté. Famille produits :ex bagages.")
433
Pyramide de l’APICS NIVEAU III de l’APICS
PDP : Plan de Production (outil opérationnel) (master schedule plan) (moyen terme) 1ère Etape Eclatement du PIC en PDP : Quels produits fabriquer?, en quelles quantités? Et pour quelles périodes?. on passe au produit fini : ex valise noire, rouge, verte,… Ensemble des PDP = PIC Permet calcul des besoins nets (CBN ou MRP1)
 (master schedule plan) (moyen terme) 1ère Etape. Eclatement du PIC en PDP : Quels produits fabriquer , en quelles quantités Et pour quelles périodes . on passe au produit fini : ex valise noire, rouge, verte,… Ensemble des PDP = PIC. Permet calcul des besoins nets (CBN ou MRP1)")
434
Pyramide de l’APICS NIVEAU III de l’APICS
PDP : Plan de Production (outil opérationnel) 2ème Etape PDP établi à partir de la demande réelle (carnet de commandes) et des prévisions commerciales. Lancement des programmes ERP chaque semaine,chaque jour pour replanifier les besoins.
 2ème Etape. PDP établi à partir de la demande réelle (carnet de commandes) et des prévisions commerciales. Lancement des programmes ERP chaque semaine,chaque jour pour replanifier les besoins.")
435
Pyramide de l’APICS NIVEAU III de l’APICS 3ème Etape
PDP : Plan de Production (outil opérationnel) 3ème Etape Lotissement et Formule de Wilson
 3ème Etape. Lotissement et Formule de Wilson.")
436
Pyramide de l’APICS NIVEAU IV de l’APICS
MRP1 (Material Requirement Planning) ou Planification de besoins en composants Calcul des composants nécessités par le carnet de commande par éclatement des nomenclatures et coefficients de liens. Différence avec des méthodes de réapprovisionnement en fonction du niveau de stocks (recomplétement)
 ou Planification de besoins en composants. Calcul des composants nécessités par le carnet de commande par éclatement des nomenclatures et coefficients de liens. Différence avec des méthodes de réapprovisionnement en fonction du niveau de stocks (recomplétement)")
437
Pyramide de l’APICS NIVEAU IV de l’APICS
MRP2 (Manufacturing Resource Planning) ou Planification des Ressources de Production. Calcul mis en œuvre par MRP1, suivi d’une phase de planification de la charge, puis d’un plan valorisé d’approvisionnement et de charge. Prend en considération les besoins en capacité des machines, en MO, en outillage, et les ressources financières (CRP = Capacity Requirement Planning)
 ou Planification des Ressources de Production. Calcul mis en œuvre par MRP1, suivi d’une phase de planification de la charge, puis d’un plan valorisé d’approvisionnement et de charge. Prend en considération les besoins en capacité des machines, en MO, en outillage, et les ressources financières (CRP = Capacity Requirement Planning)")
438
MRP Material (MRP1), Manufacturing(MRP2) ERP (finance)
, Manufacturing(MRP2) ERP (finance)")
439
MRP Material (MRP1), Limite des méthodes traditionnelles MRPII PIC
Gestion de la demande MRP OF

440
MRP1 Limite des méthodes traditionnelles
Articles gérés indépendamment les uns les autres Consommation antérieure de chacun des articles se répètera dans le futur Besoin dans le futur de chaque article sera effectif sans se préoccuper de la date de ce besoin

441
MRP2 Compte de résultat : objectifs / SIC / Prévisions
PIC (famille de produits) : famille 106, diesel, essence Gestion de la demande : on ne travaille plus sur des agrégats mais sur des articles/ éclatement des familles/ on génère un PDP avec éclatement des besoins CBN (MRP0) : on part des produits à besoin indépendant pour dérouler une arborescence des besoins dépendants pour fabriquer des besoins des articles au niveau supérieur OF ou OA : ordre d’achats ou de babrication Fabrication répétitive par campagne (kanban), discrète, sur projet, en « process » (sidérurgie, chimie)
 : famille 106, diesel, essence. Gestion de la demande : on ne travaille plus sur des agrégats mais sur des articles/ éclatement des familles/ on génère un PDP avec éclatement des besoins. CBN (MRP0) : on part des produits à besoin indépendant pour dérouler une arborescence des besoins dépendants pour fabriquer des besoins des articles au niveau supérieur. OF ou OA : ordre d’achats ou de babrication. Fabrication répétitive par campagne (kanban), discrète, sur projet, en « process » (sidérurgie, chimie)")
442
MRP2 PIC Gestion de la demande Planification des besoins en composants
Pilotage d’atelier

443
MRP2 PIC Création du plan commercial Création du plan de production
Désagrégation des valeurs prévisionnelle Gestion de la demande

444
MRP2 PIC Création du plan commercial Création du plan de production
Selon stock cible Selon couverture cible : ex je veux 3 jours de stocks Gestion de la demande Gérer les besoins bruts par le plan commercial ou le plan de production, les prévisions de vente, copie d’un autre plan, saisie manuelle : sort un programme de production

445
MRP2 MRP/CBN PIC Création du plan commercial
Création du plan de production Gestion de la demande MRP/CBN

447
Pyramide de l’APICS NIVEAU V de l’APICS Ordonnancement d’atelier
Effectué par le contremaître et le chef d’équipe Taylor a inventé les unités de temps : centième d’heure TMU= Time Measurement Unit = 1/ h = O,036s Abaques : décomposition en temps élémentaire de tous les travaux (tourner la main, avancer, pencher le buste, déplacer, saisir un objet…)
")
448
Pyramide de l’APICS NIVEAU V de l’APICS Ordonnancement d’atelier
Ensemble des actes de gestion visant à l’établissement d’un ordre de déroulement des opérations de production qui permet d’atteindre un certain optimum économique préalablement défini Choix de la machine, des outils, temps de réalisation, de réglage et de fabrication

449
Loi d’ASBY Loi de la variété requise
« La régulation d’un système n’est efficace que si elle s’appuie sur un système de contrôle aussi complexe que le système lui même »

450
ERP APS plus performants que les ERP pour la stratégie : algorithmes d’optimisation, d’aide à la décision, macro-décisions (localisation, fermeture d’usine,…) planification en une seule boucle tenant compte d’un grand nombre de contraintes (ressources, capacités, délais, coûts). Difficultés : intégration des données. ERP/ MRP fonctionne lui en plusieurs boucles hiérarchiques. ERP n’optimise pas.
 planification en une seule boucle tenant compte d’un grand nombre de contraintes (ressources, capacités, délais, coûts). Difficultés : intégration des données. ERP/ MRP fonctionne lui en plusieurs boucles hiérarchiques. ERP n’optimise pas.")
451
ERP Intégration : avoir au moins une base de données unique recouvrant au moins trois fonctions. ProAlpha n’est pas un ERP. EAI : menaces pour ERP Fiabilité : unicité, synchronisme, modification

452
ERP et MRP2 Calcul des besoins nets Eclatement des nomenclatures
OF et OA

454
Les Modules R/3 de SAP : Gestion de la Production (PP)
• PP permet à l ’ entreprise de planifier et de contrôler ses activités de production • Ses principales composantes sont : – Nomenclatures – Gammes – Postes de travail – Pic – PDP – CBN – Pilotage d ’ atelier – Of – Calcul des coûts – Fabrication répétitives – KANBAN – Planification de la production des industries de process.

456
SCM IV. Interfaces entre :
logistique stratégique, fonctionnelle et opérationnelle La logistique se décompose en 5 strates.

457
SCM & LOGISTIQUE Upperstream Log EDI Upstream Log Board Internal Log
R & D Conception Purchasing Suppliers Production Plant Logistics Marketing Distribution B to B « last mile » Client B to C Upperstream Log Pull EDI Upstream Log Board Internal Log EDI Pull Downstream Log Fonctional links Operational links Information links

458
LOGISTICS TOOLS R & D Conception Purchasing Production Suppliers
Logistics Plant Marketing Distribution B to B Client B to C Reverse Logistics Concurrent engineering simultaneous engineering TQM QFD ABC JIT SRM Board JIT, Kanban, Jidoka PokaYoké,MRP2,SMED, EDI JIT ECR DRP Fonctional links Operational links Information links

459
Third Party Logistics R & D Conception Purchasing Production Suppliers
Plant Marketing Distribution Concurrent engineering simultaneous engineering reverse logistics Performance metrics Co-manufacturing, crossdocking co-packing, warehousing Logistics providers Board EDI Continuous replenishment, carrier selection & rate negotiation, shipment planning, order processing, packaging, product return, e-trade Fonctional links Operational links Information links

460
7 "R"s & Logistics excellence
Fulfilment rate Tools Right amount DRP + JIT Right product TQM Right place DRP + ECR Right time JIT Right condition TQM Right price JIT + ABC + QFD Right information EDI + ERP + CALS XML

461
Crossdocking Non-stop logistics movement
Consolidation of products from multiple manufacturers by 3PL in a single delivery to point of sale driven « pull » inventory replenishment system. Customized deliveries of multi-tier pallets with electronic pallet content identification coupled withadvanced shipping notification.

462
Crossdocking

463
Vendor Managed Inventory (VMI)
This innovation approach shifts responsability for replenishment from buyer to supplier VMI allows continuous and frequent replenishment Popularized in the late 1980’s by Wal-Mart and Procter&Gamble One of the key programs of ECR and Quick response The vendor monitors the buyer’s inventory levels via electronic messaging and makes resupply decisions Transactions customarily initiated by the buyer (such as purchase orders) are initiated by the supplier. EDI is an enabler
 are initiated by the supplier. EDI is an enabler.")
464
Collaborative approach
The focus on SC solution will force unprecedented collaborative between vendors, manufacturers, warehouses, transport service providers, customers and end-consumers. Collaborative Planning & Forecasting Relationship (CPFR)
")
465
Les Modules R/3 de SAP : Gestion de Projet (PS)
• Il est conçu pour gérer la planification, le contrôle et le suivi de projets à long terme relativement complexes, dans le cadre d ’ objectif clairement définis. • Ses principales composantes sont : – Gestion de la trésorerie et des ressources – Maîtrise de la qualité – Gestion des temps – Système d ’ information de direction du projet

466
Logistique intégrée ou SCM
Logistique d’extrême aval : « dernier km » Logistique aval et DRP Outils : ECR, CRM,CPFR, JIT Logistique interne de OGP MRP2, JIT, KANBAN, POKA YOKE, JIDOKA, SMED, OTED, TAKTIME Logistique amont d’approvisionnement Logistique d’extrême amont (ingénierie simultanée, analyse de la valeur) et rétro-logistique
 et rétro-logistique.")
467
Les Modules R/3 de SAP : Administration des ventes (SD)
• SD permet à l ’ entreprise d ’ optimiser l ’ ensemble des tâches et activités liées à la vente, la livraison et la facturation. • Ses principales composantes sont : – Avant-vente – Gestion des demande d ’ offre – Gestion des offres – Gestion des commande clients – Gestion des livraisons – Facturation – Système d ’ information commerciales.

468
Distribution Outsourcing
Companies focus on core competencies Takes advantage of the expertise that distribution companies have developed Tends to lower inventory levels and reduce costs

469
Transportation Movement of the product from one location to another
Important element, often overlooked Common methods are railroads, trucking, water, air, intermodal, package carriers, and pipelines

470
Railroads 150,000 miles in US Good for low-value, high-density, bulk products over long distances Less flexible, slower and less convenient than trucks Worst record of quality performance

471
Trucking Most used mode in US Two major forms of trucking
Full-truckload (TL) Less-than-truckload (LTL) Flexible, small loads Consolidation, Internet load match sites Single sourcing reduces number of trucking firms serving a company
 Less-than-truckload (LTL) Flexible, small loads. Consolidation, Internet load match sites. Single sourcing reduces number of trucking firms serving a company.")
472
Air Rapidly growing segment of transportation industry
Lightweight, small items Quick, reliable, expensive Major airlines and US Postal Service, UPS, FedEx, DHL

473
Package Carriers FedEx, UPS, US Postal Service, DHL
Significant growth driven by e-businesses Use several modes of transportation Expensive Fast and reliable Innovative use of technologies

474
Intermodal Combination of several modes of transportation
Most common are truck/rail/truck and truck/water/rail/truck Enabled by the use of containers

475
Water One of oldest means of transport Low-cost, high-volume, slow
Bulky, heavy and/or large items Standardized shipping containers improve service The most common form of international shipping

476
Pipelines Primarily for liquid products, e.g., oil, petroleum products
Slurry lines carry coal or kaolin High capital investment Low operating costs Long life Can cross difficult terrain

477
Internet Transportation Exchanges
Bring together shippers and carriers Initial contact, negotiations, auctions Typically only one form of transportation, intermodal exchanges have been difficult to develop

478
The Transportation Method
Ship items at lowest cost Sources have fixed supplies Destinations have fixed demand

479
Supply Chain Management Software
Enterprise Resource Planning (ERP) Software that connects the components of the company (including the supply chain) by sharing and organizing information and data Through information flows ERP organizes and manages business processes
 Software that connects the components of the company (including the supply chain) by sharing and organizing information and data. Through information flows ERP organizes and manages business processes.")
480
Figure 7.8 Linking the Supply Chain with SAP

481
Global Supply Chain Free trade & global opportunities
Nations form trading groups No tariffs or duties Freely transport goods across borders

482
Global Supply Chain Problems
National and regional differences Customs, business practices, and regulations Foreign markets are not homogeneous Quality can be a major issue

483
Duties and Tariffs Companies may use duty specialist to advise how duties affect supply chain decisions and/or avoid duties Trade specialists may be used to manage transportation and distribution operations in a foreign country International freight forwarders Custom house brokers Export packers Export management companies Export trading companies

484
Duties and Tariffs Proliferation of trade agreements among nation groups Group members charge uniform tariffs Member nations have a competitive advantage within the group

485
Duties and Tariffs APEC NAFTA TAFTA FTAA ASEAN CALM ATPA MERCOSUR
ANZCERTA FTAA NAFTA CALM ATPA MERCOSUR TAFTA Figure 7.9

486
Landed Cost and Internet-Based International Trade Logistics (ITL) Systems
Knowing landed cost is critical in international trade Common components are transportation charges, tariffs, duties, and taxes ITL software systems convert language and currency between trading partners ITL companies can provide a variety of trade-related services

487
Infrastructure Obstacles to Global Trade
Some emerging markets lack suitable distribution systems, i.e. roads, rail systems Existing roads and ports may be inadequate Market instability, political instability Vertical integration is a common solution

488
Legal aspects Carriage contract & juridical aspects
Case law (jurisprudence) Dispute agreement Basics
 Dispute agreement. Basics.")
489
Carriage Law Art ex 100 :transfer of title
Art ex 101 & ex 102 : Waybill

490
Carriage Law Art ex 100 (L132- 6)
« Res perit domino » (art 1584 Civil code) Transfer of title & Incoterms Transfer of title & Dubanchet’s Law Eigentumsvorbehaltklausel
 Transfer of title & Incoterms. Transfer of title & Dubanchet’s Law. Eigentumsvorbehaltklausel.")
491
SCM Validity of a transfer of title (ToT) clause
Being known from the customer before goods live the vendor’s local When written on the back of a document, a mention must be inserted on the face like « see overleaf our ToT clause » Be written in bold or italic, different from the rest of the text.

492
SCM Direct action against the carrier
Art ex 101 of the Commercial law (Art L132-8) The consignment note forms a carriage contract between the Shipper, the Forwarder, in case of C or D sales
 The consignment note forms a carriage contract between the Shipper, the Forwarder, in case of C or D sales.")
493
SCM Art ex 101 of Commercial Law (Art L132-8)
The carriage contract is in fact not formal but CONSENSUAL Consequence (+): we can contractualy act against the carrier even if no carriage document has been filled Consequence (-) : the carrier can act against his principal in the same circunstances
: we can contractualy act against the carrier even if no carriage document has been filled. Consequence (-) : the carrier can act against his principal in the same circunstances.")
494
SCM Article ex 102 Commercial Law (L132-9)
Mentions on the consignment note adresses Weight, Measures, Units, nomenclatures (entry in the account elements) Delivery time other instructions
 Delivery time. other instructions.")
495
Liability for loss or damage
Art ex 103 (L133-1) Presumption of responsibility, result obligation The carrier can’t declare himself fully unresponsible for theft, loss,etc … Partial reparation limits are legal except in case of heavy fault or wilfull misconduct. Relief causes: force majeure,inherent defect (outage), third part liability (packing failure)
 Presumption of responsibility, result obligation. The carrier can’t declare himself fully unresponsible for theft, loss,etc … Partial reparation limits are legal except in case of heavy fault or wilfull misconduct. Relief causes: force majeure,inherent defect (outage), third part liability (packing failure)")
496
Liability in case of delays
Art ex-104 (L133-2) Debarment for delays presumption of liability for delays excepted in case of force majeure Legal reparation limits (refund of the freight costs) Formal notice obligation to obtain damages Special Delivery Interest cover
 Debarment for delays. presumption of liability for delays excepted in case of force majeure. Legal reparation limits (refund of the freight costs) Formal notice obligation to obtain damages. Special Delivery Interest cover.")
497
Carriage Law Art ex 105 (L133-3)
Debarment for partial loss and damages Concerns the relation between consignee and last carrier. Precise remarks to be written by the consignee on the consignment note Confirmation by registered letter within three following days

498
Carriage Law Art ex 106 (L 133-4 of Commercial Law)
Special transport judicial expertise

499
Carriage Law Art ex 107 (L 133-5)
All the articles seen above and after concern every kind of inland transportation (road, rail, river)
")
500
Carriage Law Art ex-108 (L133-6 Commercial Law)
Time limit for proceedings Comparison with other limitations periods in other contracts Limitation period calculation Suspension, Interruption, Interversion (admission of guilt), Novation (promise of guilt) Reconventional action
, Novation (promise of guilt) Reconventional action.")
501
Inbound Law /CMR CMR (Geneva Convention) Art 8 + Art 17-2 + Art 17-4
Inbound law (Code de Commerce) Art L (ex 101) : Direct action Art L (ex 102) : Waybill Art L (ex 103) : Presumption for loss & damage Art L (ex 104) : Presumption for delay Art L (ex 105): Debarment for partial loss & damage Art L (ex 106) : Expertise Art L (ex 108) : Limitation CMR (Geneva Convention) Art 8 + Art Art 17-4 Art 19 (21 days) Art 23 + Art 27 Precises remarks on the CMR Art 32 : one year + special limitations
 Art L (ex 101) : Direct action. Art L (ex 102) : Waybill. Art L (ex 103) : Presumption for loss & damage. Art L (ex 104) : Presumption for delay. Art L (ex 105): Debarment for partial loss & damage. Art L (ex 106) : Expertise. Art L133-7 (ex 108) : Limitation. CMR (Geneva Convention) Art 8 + Art Art Art 19 (21 days) Art 23 + Art 27. Precises remarks on the CMR. Art 32 : one year + special limitations.")
502
Inbound Law / CMR (Code de Commerce) Art L (ex 108) : prescription CMR Art 32 : one year + special limitations for delay and other action Total loss : 1 year +30 or 60 days Other actions : 1 year + 3 months

503
Inland Law /CMR Code de Commerce Art L133-7 (ex 108) : Limitation
Contractual suspension CMR Art 32 : alinea 4 Suspension : first letter of reclamation trigger damages at a rate of 5% /year

504
Inbound Law/CMR Code de Commerce Art L 133-3 (ex 105) :
Unconcealed damages Remarks + Confirmation by Registered Letter within 3 following days Concealed damages Must be discovered in the presence of the driver. CMR Unconcealed damages Precise remarks on the CMR consignment note confirmation not necessary - Concealed damages - presumption of liability during 7 days after date of delivery

505
Inbound Law /CMR Code de Commerce
Art L (ex 104) : Delay debarment Formal notice, except when « accelaration clause » CMR Art 8 + Art 17-2 + Art 17-4 claim within 21 days
 : Delay debarment. Formal notice, except when « accelaration clause » CMR. Art 8 + Art Art claim within 21 days.")
506
B/L and Letter of Credit
Maritime stage From EXW to DEQ Inland haulage Tally Sheet & B/L issue B/L and Letter of Credit B/L accomplishment

507
Issuing a clean B/L Tally sheet (feuille de pointage)
THC : Terminal Handling Charges CSC : Container Service Charges « on board » mention Freight collect or prepaid

508
Bill of Lading The 3 functions of B/L Contract of carriage Liner terms
Document that enables the transfer of property on arrival if the consignee holds the right original B/L

509
B/L or Bill of Lading 3 types of document componing the full set of B/L (jeu complet de connaissement). Original : no more than 3 of them Ship’s copy (connaissement chef) : given to the captain on board the ship. Not negotiable
 : given to the captain on board the ship. Not negotiable.")
510
B/L or Bill of Lading The 3 ways for filling up the consignee box
Leaving it blank, to bearer (au porteur) Named person B/L (à personne dénommée) To order B/L
 Named person B/L (à personne dénommée) To order B/L.")
511
B/L or Bill of Lading Accomplishment of the B/L
Comparing the Ship’s copy of the captain with the B/L of the consignee Checking the content of consignee box If freight collect : asking for payment Delivery order necessary for leaving the port Accomplishment of the B/L with mention « void »

512
Pathology ! The Mate is not OK with the goods presented when tallying!. He puts « remarks » on the tally sheet like : « shortage », « goods damaged »! These remarks must be rewritten on the B/L or the Captain will not put the mention « on board ». The original B/L’s will be « foul »,« unclean » or claused DANGER : the beneficiary will not be paid by the confirming bank Regarding remarks like « STW »,« "STC », « STB »

513
Pathology when loading !
The Mate is not OK with the goods presented when tallying!. He puts « remarks » on the tally sheet like : «shortage», « goods damaged »! These remarks must be rewritten on the B/L or the Captain will not put the mention « on board ». The original B/L’s will be «foul»,«unclean» or «claused». DANGER : the beneficiary will not be paid by the confirming bank Regarding remarks like «STW »,«STC », « STB »

514
Finding a remedy for the Pathology
How to get a clean B/L that should be «unclean»?. By issuing a « Letter of Indemnity » (Lettre de garantie simple) Letter written by the shipper in favor of the carrier asking for a clean B/L and indemnifying the carrier in advance from all consequences. Tolerated if hiding shortcomings Fraudulent if concealing quality defects
 Letter written by the shipper in favor of the carrier asking for a clean B/L and indemnifying the carrier in advance from all consequences. Tolerated if hiding shortcomings. Fraudulent if concealing quality defects.")
515
Second Pathology on arrival
The original B/L are not available when Ship (and goods) arrives at the port of destination!. The consignee can’t withdraw his shipment. Possibility to ask the issuing bank for a banking letter of garanty (lettre de garantie bancaire) With this letter, the captain will accept to take the risk to deliver the goods without accomplishing the B/L.
 arrives at the port of destination!. The consignee can’t withdraw his shipment. Possibility to ask the issuing bank for a banking letter of garanty (lettre de garantie bancaire) With this letter, the captain will accept to take the risk to deliver the goods without accomplishing the B/L.")
516
Other clauses on B/L No deck allowed May be stowed as Deck Cargo
Clause : both to blame collision clause

517
Charter Party (charte partie)
Intervening parties True owner (véritable propriétaire, investisseur) Shipowner (armateur) Owner(fréteur) Charterer (affrèteur) Broker (courtier)
 Shipowner (armateur) Owner(fréteur) Charterer (affrèteur) Broker (courtier)")
518
Charter Party (charte partie)
to fit out a ship (armer un navire) - to fit out tackles & gears (fournir agrès et apparaux) - shipchandling (avitailler) - crewing: captain, seamen,ship’s boy, ... - hull insurance by Protection & Indemnity Clubs (P&I). (assurance corps de navire)
 - to fit out tackles & gears (fournir agrès et apparaux) - shipchandling (avitailler) - crewing: captain, seamen,ship’s boy, hull insurance by Protection & Indemnity Clubs (P&I). (assurance corps de navire)")
519
Bare boat C/P C/P coque nue
C/P Coque nue (bare boat C/P) Owner Charterer - Risques nautiques (Management of the Ship) NO YES - Risques commerciaux (Management of the cargo) NO YES
 Owner Charterer. - Risques nautiques. (Management of the Ship) NO YES. - Risques commerciaux. (Management of the cargo) NO YES")
520
Time C/P C/P à temps Owner Charterer (Management of the Ship) YES NO
- Risques nautiques (Management of the Ship) YES NO - Risques commerciaux (Management of the cargo) NO YES
 YES NO. - Risques commerciaux. (Management of the cargo) NO YES")
521
Voyage C/P C/P au voyage
Owner Charterer - Risques nautiques (Management of the Ship) YES NO - Risques commerciaux (Management of the cargo) NO YES
 YES NO. - Risques commerciaux. (Management of the cargo) NO YES.")
522
Technical terms to explain
« how to use the Ship and not abuse her » Demise of ship. « Time runs for the owner » According to the berth terms (acc.b.t) Weather Working Days (WWD) Lay Days (jour de planche) NOR (Notice of readiness) Demurrage (surestaries, Liegegelder) « once on demurrage, always on demurrage » Over over Demurrage (sursurestaries)
 Weather Working Days (WWD) Lay Days (jour de planche) NOR (Notice of readiness) Demurrage (surestaries, Liegegelder) « once on demurrage, always on demurrage » Over over Demurrage (sursurestaries)")
523
Technical terms to explain
Dispatch money (prime de célérité) Reversabilité du temps sauvé Clauses WIBON or WIPON Whether in berth/ in port or not Berth = poste à quai
 Reversabilité du temps sauvé. Clauses WIBON or WIPON. Whether in berth/ in port or not. Berth = poste à quai.")
524
SCM Intra-Communuty Flows 6th Brussels Directive
New obligations for the firms since the 1rst of january 1993 Mentions on the invoices (B2B) VAT Declaration of trade in goods Goods register (stocks records)
 VAT. Declaration of trade in goods. Goods register (stocks records)")
Présentations similaires


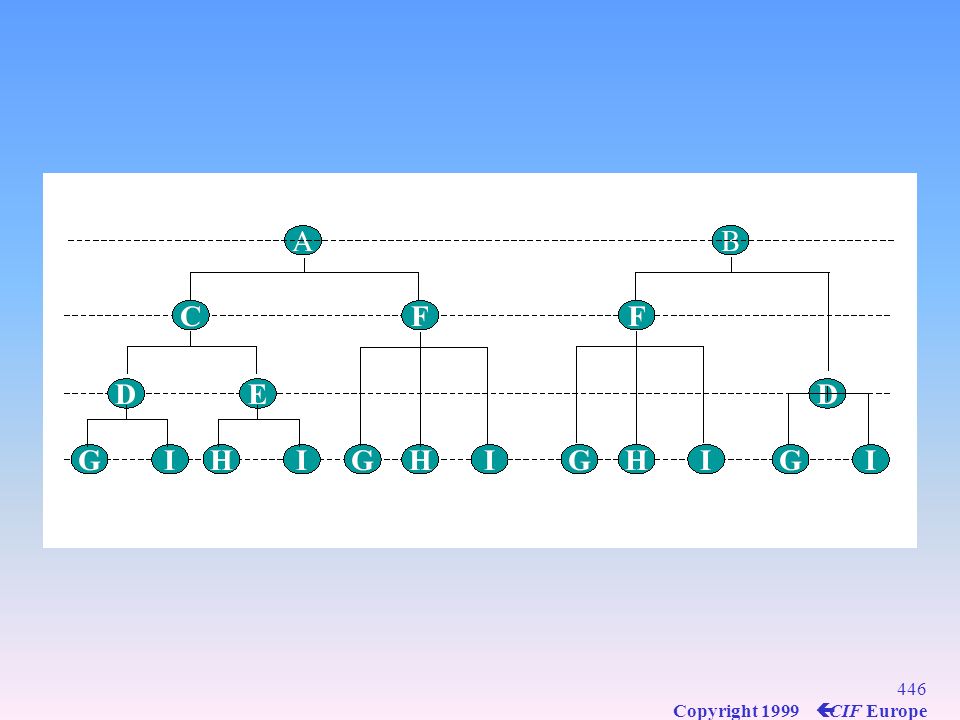
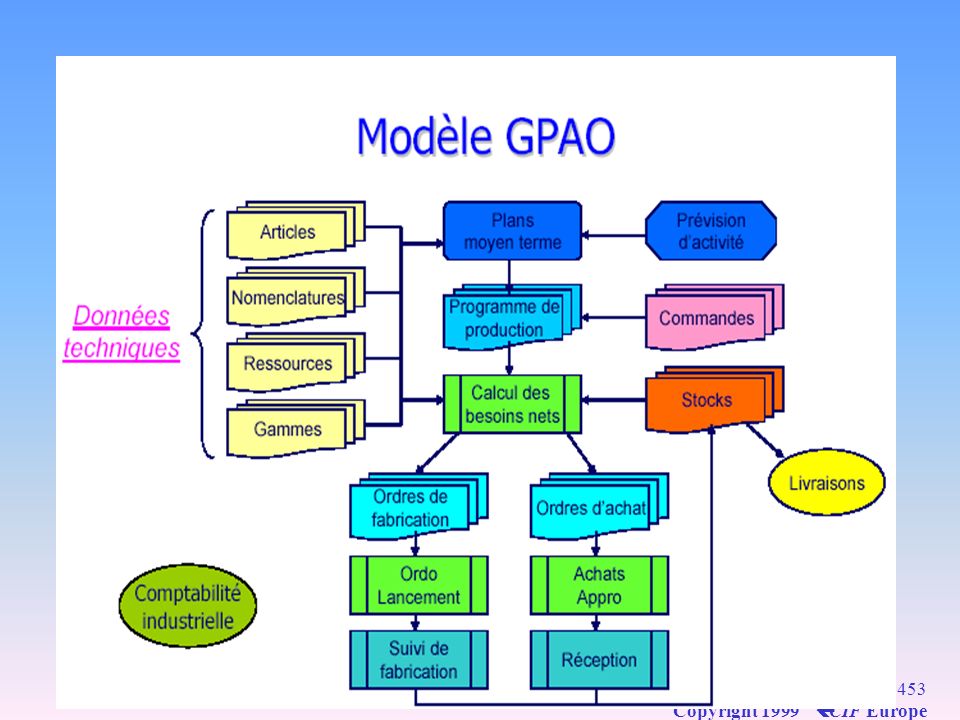
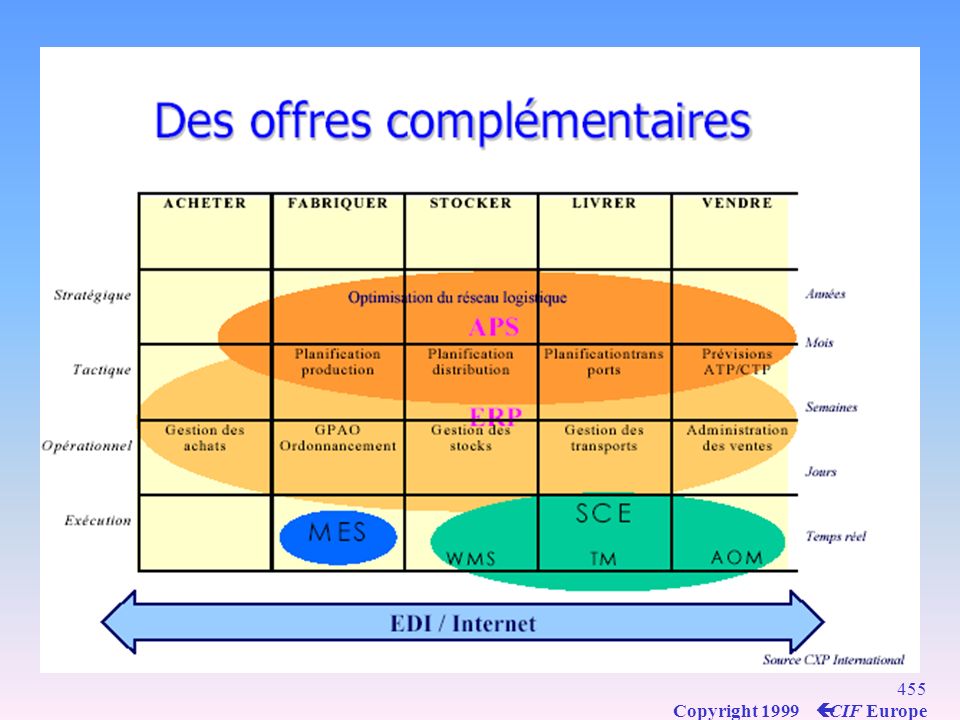


![[number 1-100] There is no rule to the way to remember the names for the numbers 1 to 10 in French so we recommend that you simply practice!](/1/172873/big_thumb.jpg "[number 1-100] There is no rule to the way to remember the names for the numbers 1 to 10 in French so we recommend that you simply practice!>")
 - Jean Rauscher>")
 in the Business.>")


