Télécharger la présentation
La présentation est en train de télécharger. S'il vous plaît, attendez

1
REGULATION DE l’AMPkinase Fabrizio Andreelli CHU Bichat et INSERM U 695

2
L’énergie…c’est la vie !!

3
Lipolyse (à jeun) Lipogenèse (nourri)
 Lipogenèse (nourri)")
4
TG alimentaires AGL TG AGL + glycérol

5
Au moins deux phénomènes
Résistance à l’insuline Altération de l’insulinosécrétion

6
Un phénotype stéréotypé…
Production hépatique de glucose Stéatose hépatique Insulinorésistance Lipolyse accrue AGL Glycérol Insulinorésistance

7
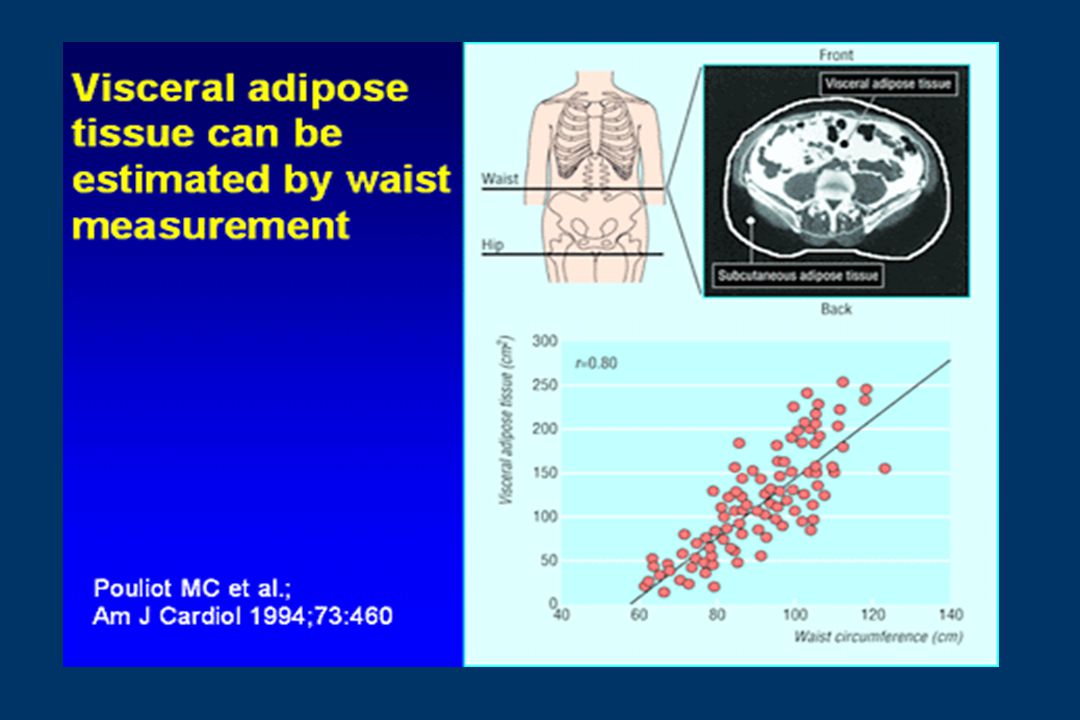
C.Tour de taille J Vague 1947

8
AGL Muscle Stéatose TG AGL Cellule Lipotoxicité et TAV
insulinorésistance TG AGL insulinosécrétion

9
Relations TAV et NASH Nature 2006

10
Dépôts lipidiques extra-adipocytaires: muscle
Greco AV et al. Diabetes 2002

11
Dépôts lipidiques extra-adipocytaires: foie

12
Dépôts lipidiques extra-adipocytaires: beta cell
Rat OLEFT Jia MD et al, Diabetes 2000

13
Cancello R et al. Diabetes 2005

14
Miyazaki Y et al. AJP 2002

15
LAYERED Whole-body images such as these allow measurements of total body fat, among other parameters. On the far left, images show all the tissue compartments, each represented by a unique color, for a lean person (top) and an overweight person (bottom). The next images in each series show what's left after removal of subcutaneous adipose tissue (green), muscle tissue (red), and residual tissue (yellow). In the rightmost images, visceral adipose tissue is shown in gray and intramuscular adipose tissue in pink. Images were composed computationally from magnetic resonance imaging scans of cross-sectional slices of a whole body. COURTESY OF THE IMAGE READING CENTER, ST. LUKE'S HOSPITAL OF COLUMBIA UNIVERSITY MEDICAL CENTER

17
Syndrome métabolique

18
Obésité - répartition Tour de taille mesuré
En position debout et en expiration douce A mi-hauteur entre rebord costal inférieur crête iliaque Risque Risque élevé Homme 94 cm 102 cm Femme 80 cm 88 cm d’après Lean (1995)
")
19
Conséquences du syndrome métabolique
Insulinorésistance Diabète de type 2 Sd métabolique Risque cardio-vasculaire

20
Intra-abdominal adiposity and glucose metabolism
Insulin 15 1 1,2 1200 1,2 1,2 Area Area 12 1 1,2 1,2 1 1 1,2 800 9 1,2 mmol/L 1 1 pmol/L 1 1,2 1 1,2 6 1 400 1,2 3 1,2 60 120 180 60 120 180 Intra-abdominal adiposity and glucose metabolism These data are from the study described in the previous slide. Plasma glucose and insulin concentrations during an oral glucose tolerance test (the inset graphs show area under the plasma concentration-time curves) were broadly similar in lean subjects and in obese subjects with low intra-abdominal adiposity. The presence of obesity per se therefore did not appear to influence glycaemic status in these subjects. In contrast, plasma glucose concentrations were significantly higher in obese subjects with high intra-abdominal adiposity, compared with the lean controls. While glucose levels generally differed little between obese subjects with high and low intra-abdominal adiposity, a markedly and significantly greater hyperinsulinaemia was required to maintain these glucose levels in the obese/high intra-abdominal adiposity group. These results show that intra-abdominal adiposity is a more important cause of insulin resistance than obesity per se. Pouliot MC, Despres JP, Nadeau A et al. Visceral obesity in men. Associations with glucose tolerance, plasma insulin, and lipoprotein levels. Diabetes 1992;41: Time (min) Time (min) Non-obese Obese low IAA Obese high IAA IAA: intra-abdominal adiposity Significantly different from 1non-obese, 2obese with low intra-abdominal adiposity levels Pouliot et al 1992 1
 were broadly similar in lean subjects and in obese subjects with low intra-abdominal adiposity. The presence of obesity per se therefore did not appear to influence glycaemic status in these subjects. In contrast, plasma glucose concentrations were significantly higher in obese subjects with high intra-abdominal adiposity, compared with the lean controls. While glucose levels generally differed little between obese subjects with high and low intra-abdominal adiposity, a markedly and significantly greater hyperinsulinaemia was required to maintain these glucose levels in the obese/high intra-abdominal adiposity group. These results show that intra-abdominal adiposity is a more important cause of insulin resistance than obesity per se. Pouliot MC, Despres JP, Nadeau A et al. Visceral obesity in men. Associations with glucose tolerance, plasma insulin, and lipoprotein levels. Diabetes 1992;41: Time (min) Time (min) Non-obese Obese low IAA Obese high IAA. IAA: intra-abdominal adiposity Significantly different from 1non-obese, 2obese with low intra-abdominal adiposity. levels. Pouliot et al")
21
AGL Tissu adipeux abdominal

22
AMPKinase Changements métaboliques Environnement hormonal
Effets enzymatiques Effets géniques

23
Structure de l'AMP-kinase
regulatory SU 1, 2, 3 catalytic SU regulatory SU 1, 2 1, 2, 3 1, 2

24
Structure of AMP-activated protein kinase
CaMKK LKB1 AMPK kinase Catalytic subunit 1, 2 N Thr172 C Catalytic domain binding 1, 2 N C Glycogen binding binding Regulatory subunit R302Q H383R T400N N488I R531G mutations 2 1, 2, 3 N CBS1 CBS2 CBS3 CBS4 C AMPK AMP/ATP binding R225Q mutation 3

25
AMP is signal of energy depletion
fatty acid oxidation fatty acid synthesis

26
Regulation of AMP-activated protein kinase
• ischemia • hypoxia • glucose deprivation • metabolic poisons AMP/ATP Adenylate kinase ATP ATP ADP AMP physical exercise AMP AMP AMP Pi ATP LKB1 CaMKK Phosphatases AMPK ADP H2O ADP AMP ATP-consuming AMP = -AMPK ATP AMP ATP-generation AMP ADP

27
Regulation of AMP-activated protein kinase
CaMKK inactive AMPK LKB1 CBS4 a AMPKK b P AMP ATP T172 active AMPK AMP CBS4 : Catalytic subunit : Scaffold/glycogen-binding : Regulatory (AMP-binding)
")
28
+ Insuline P IRS-1 PI-3 kinase Glut4 Glucose Glucose AICAR AMPK Ox
Stockage

29
Bergeron R et al. AJP 1999

30
Bergeron R et al. Diabetes 2001

31
Le traitement de rongeur par AICAR
-augmente la captation intramusculaire de glucose même en présence d’une insulinorésistance *rongeur sain *rongeur obèse

32
Winder WW. J Appl Physiol 2001

33
Mu J et al. Mol Cell 2001

34
Mu J et al. Mol Cell 2001

35
Mu J et al. 2003

36
La réduction spécifique de l’activité de l’AMPK dans les muscles
-s’associe à une diminution de la captation de glucose contraction dépendante -réduit la synthèse de glycogène -altère sa re-synthèse post-exercice physique -n’altère pas la signalisation de l’insuline musculaire -n’altère pas la sensibilité à l’insuline in vivo ni la glycémie

37
Les mutations activatrices des sous-unités de l’AMPK
entraînent une accumulation de glycogène intramusculaire (muscle squelettique 3 et cœur 2) et participent à la physiopathologie des syndromes de pré-excitation cardiaque (WPW).
 et participent à la physiopathologie. des syndromes de pré-excitation cardiaque (WPW).")
38
Arad M et al. Circulation 2003

39
L’activation de l’AMPK musculaire par la contraction ou l’AICAR
augmente la synthèse de glycogène musculaire Les mutations activatrices de l’AMPK dans le muscle ou le cœur provoquent l’accumulation de glycogène et favorisent des troubles de conduction

40
Le traitement de rongeur par AICAR
-augmente la captation intramusculaire de glucose -réduit la production hépatique de glucose et la stéatose hépatique *rongeur sain *rongeur obèse

41
Bergeron R et al. Diabetes 2001

42
Zhou G et al. J Clin Invest 2001

43
Acétyl-CoA carboxylase
Metformine Glucose Glucose-6P Pyruvate Citrate Krebs FFA FFA + Acyl-CoA AMPK CPT-1 Acétyl-CoA - -Oxydation Acétyl-CoA carboxylase (ACC) Acétyl-CoA Malonyl-CoA
 Acétyl-CoA. Malonyl-CoA.")
44
L’activation pharmacologique de l’AMPK
-augmente la captation intramusculaire de glucose -réduit la production hépatique de glucose -réduit la lipogenèse hépatique *rongeur sain *rongeur obèse Intérêt thérapeutique dans le diabète de type 2 !!

45
Phenotypic analysis of AMPK KO mice
AMPK1-/- AMPK2-/- KO is embryonic lethal

46
Cre-loxP Strategy Recombinase from bactériophage P1 = 34bp sequence
DNA LoxP LoxP + CRE Activity in vitro Recombinase - without DNA replication - without topo activity - without cofactors +

47
mice harbouring a complete
Total inactivation of 2 AMPK x EIIA promoter ( zygote) CRE mice harbouring a complete inactivation of 2
 CRE. mice harbouring a complete. inactivation of 2.")
48
Characterization of AMPK KO mice
Southern blot Southern blot +/- +/+ -/- +/- +/+ -/- 2 wt 1 wt 1 ko 2 ko Western blot Western blot +/+ -/- +/+ -/- +/+ -/- +/+ -/- AMPK1 AMPK1 AMPK2 AMPK2 liver muscle liver muscle Viollet, JCI2003 Jorgensen, JBC2004

49
a1a2 KO E9.5 dpc E11.5 dpc -> embryonic lethality around 10.5 dpc.
Control a1-/- a2-/- E9.5 dpc Alive no morphological differences E11.5 dpc Dead morphological aspect of E10.5 AMPK complexes play an essential role during embryonic development.

51
AMPK2-/- mice are not obese
Body weight % of fat mass Food intake 8 4 40 6 30 3 %of fat mass body weight (g) 4 20 Food intake (g/d)) 2 2 10 1 +/+ -/- +/+ -/- +/+ -/- F Andreelli, J Clin Invest 2001
 Food intake (g/d)) /+ -/- +/+ -/- +/+ -/- F Andreelli, J Clin Invest")
52
Glucose tolerance test in AMPK KO mice
350 control * control 220 ** AMPK1-/- AMPK2-/- 300 200 * 250 180 glucose (mg/dl) 200 160 glucose (mg/dl) 150 140 120 100 time (min) time (min) 100 50 20 40 60 80 100 120 20 40 60 80 100 120 0,5 Insulinemia at 20min (ng:ml) Insulinemia at 20min (ng:ml) 0,3 * 0,4 0,3 0,2 0,2 0,1 0,1 +/+ -/- +/+ -/- F Andreelli, J Clin Invest 2001
 glucose (mg/dl) time. (min) time. (min) ,5. Insulinemia. at 20min (ng:ml) Insulinemia. at 20min (ng:ml) 0,3. * 0,4. 0,3. 0,2. 0,2. 0,1. 0,1. +/+ -/- +/+ -/- F Andreelli, J Clin Invest")
54
Metabolic parameters during euglycemic hyperinsulinemic clamp in AMPK2-/- mice
-20 20 40 60 80 100 120 Glucose TO HGP Glycolysis Gln Synthesis control AMPK2 -/- ** F Andreelli, J Clin Invest 2001

55
Muscle glycogen during clamp in AMPK2-/- mice
control AMPK2-/- 100 200 300 400 500 600 700 800 Gln synthesis ** 0,25 0,5 Total Gln content * F Andreelli, J Clin Invest 2001

56
F Andreelli, J Clin Invest 2001
100 120 140 160 180 200 220 20 40 60 80 time (min) * ** glucose (mg/dl) control AMPK2-/- 0,1 0,2 0,3 +/+ -/- Insulinemia at 20min (ng:ml) F Andreelli, J Clin Invest 2001
 * ** glucose (mg/dl) control. AMPK2-/- 0,1. 0,2. 0,3. +/+ -/- Insulinemia. at 20min (ng:ml) F Andreelli, J Clin Invest")
57
In vitro glucose transport in AMPK2-/- muscle
Deoxyglucose transport (µmol/g/h) 0,5 1 1,5 2 2,5 basal insulin +/+ Soleus EDL -/- F Andreelli, J Clin Invest 2001
 0, , ,5. basal. insulin. +/+ Soleus. EDL. -/- F Andreelli, J Clin Invest")
58
In vitro glucose-stimulated insulin secretion
0.05 0.1 0.15 0.2 0.25 insulin release as % content 15 30 45 60 75 90 105 120 Time (min) 7.5 10 20 L-Arg 3 mM glucose AMPK2-/- control Insulin content per islet is similar: 67.2 16.2 ng/islet (AMPK2-/-) versus 63.9 16.5 ng/islet (control) F Andreelli, J Clin Invest 2001
 L-Arg. 3. mM glucose. AMPK2-/- control. Insulin content per islet is similar: 67.2 16.2 ng/islet (AMPK2-/-) versus 63.9 16.5 ng/islet (control) F Andreelli, J Clin Invest")
59
Why are AMPK2-/- mice insulinopenic?
AMPK2-/- mice do not present: - hypokaliemia - hyperleptinemia - increased TG content in pancreas modification of sympathetic and parasympathetic balance activity?

60
Urinary catecholamine levels in AMPK2-/- mice
10 20 30 40 50 ** urinary epinephrine (ng/d) * urinary dopamine (ng/d) 500 1000 1500 2000 2500 urinary norepinephrine (µg/d) epinephrine norepinephrine dopamine +/+ -/- F Andreelli, J Clin Invest 2001
 * urinary dopamine (ng/d) urinary norepinephrine (µg/d) epinephrine. norepinephrine. dopamine. +/+ -/- F Andreelli, J Clin Invest")
61
-adrenergic antagonist treatment of AMPK2-/-mice
Glucose tolerance test 50 100 150 200 250 300 20 40 60 Time (min) * ** % of basal glucose saline phentolamine control AMPK2-/- F Andreelli, J Clin Invest 2001
 * ** % of basal glucose. saline. phentolamine. control. AMPK2-/- F Andreelli, J Clin Invest")
62
Is impaired glycogen synthesis linked to the lack of AMPK activity in skeletal muscle?
use of AMPK-DN mice expressing a dominant inhibitory mutant of AMPK in skeletal muscle. (Mu et al., 2001) AMPK-DN creatine kinase promoter
 AMPK-DN. creatine kinase promoter.")
63
Glucose tolerance in AMPK-DN mice Glucose tolerance test
500 control AMPK-DN 400 300 serum glucose (mg/dl) 200 100 -30 30 60 90 time (min)
 time (min)")
64
Alpha 2-AMPK KO mice are insulin resistant
--> In vivo insulin stimulated glycogen synthesis is reduced Glycogen synthesis rate ng/min.mg Control + Insulin 100 50 - AMPK DN muscle + - AMPK KO Alpha 2 + - * Insulin resistance is not due to lack of muscle AMPK

65
Altered regulation of metabolism in AMPK2-/- mice
glucose insulin high sympathetic tone catecholamine insulin glycogen synthesis F Andreelli, J Clin Invest 2001

66
Rôle essentiel de la sous-unité alpha 2 dans les actions métaboliques de l’AMPK.

67
Diabetes 2004

68
La délétion de la sous-unité alpha 2 de l’AMPK dans tous les tissus altère la sensibilité à l’insuline et prédispose à l’obésité. Intérêt en génétique humaine ?

69
Quid de l’effet tissu-spécifique de l’AMPK
Quid de l’effet tissu-spécifique de l’AMPK ? KO alpha 2 spécifique du foie

70
Liver a2 KO x 2flox Andreelli F et al, Endocrinology 2006 Liver 2 KO
WT liver 2 AMPK1 AMPK2 CRE Albumin promoter 2flox x Liver 2 KO fl/fl; cre+ hypothalamus fl/fl; cre+ adipose tissue fl/fl; cre+ pancreas fl/fl; cre+ muscle fl/fl; cre liver +/+; cre+ liver fl/fl; cre+ liver fl/fl; cre+ liver wt deleted floxed Andreelli F et al, Endocrinology 2006

71
Andreelli F et al, Endocrinology 2006

72
Régulation hormonale de la PHG
Insuline - Néoglucogenèse - Leptine Adiponectine

73
Pas de conséquence sur la signalisation de l’insuline
Table adiponectine Pas de conséquence sur la signalisation de l’insuline Perte du contrôle de la PHG par la leptine et l’adiponectine Andreelli F et al, Endocrinology 2006

74
Leptine Adiponectine Insuline + AMPKalpha 2 Néoglucogenèse

75
Surexpression de l’AMPkinase

76
Expression of AMPK2-CA by in vivo adenovirus-mediated gene transfer in mice
+ Adenovirus AMPK2-CA 48h infection Sacrifice Adenovirus injection 1.109 pfu effect on glycemia analysis of gene expression in fasted/refed conditions Diabetes 2005

77
CA-AMPK -> injection of adenovirus expressing constitutively active AMPK in control and diabetic mouse models fasted glucose PEPCK mRNA 1.2 300 1.0 250 0.8 200 §§ Ad b-gal Relative mRNA Level Blood Glucose (mg/dl) 0.6 Ad CA-AMPK 150 §§ 0.4 100 §§ §§ 50 0.2 wt ob/ob STZ wt ob/ob STZ Liver AMPK targeting is sufficient to control glycemia in diabetic mice. Diabetes 2005
 0.6. Ad CA-AMPK §§ §§ §§ wt. ob/ob. STZ. wt. ob/ob. STZ. Liver AMPK targeting is sufficient to control glycemia in diabetic mice. Diabetes")
78
Acétyl-CoA carboxylase
Leptine Adiponectine Metformine TZDs Glucose Glucose-6P Pyruvate Citrate Krebs FFA FFA + Acyl-CoA AMPK CPT-1 Acétyl-CoA - -Oxydation Acétyl-CoA carboxylase (ACC) Acétyl-CoA Malonyl-CoA
 Acétyl-CoA. Malonyl-CoA.")
79
Patti ME, Kahn BB. Nature Medicine 2004

80
Rôle essentiel de la sous-unité alpha 2 de l’AMPK dans les actions métaboliques. Rôle de la SU alpha 1 ?

81
AMPK1 KO mice are anemic
RBC (106/ml) Hb (g/dl) Ht (%) 20 12 60 1 KO 10 *** 16 50 *** *** 8 12 40 6 8 30 4 20 2 4 10 +/+ -/- +/+ -/- +/+ -/- 2 4 6 8 10 12 RBC (106/ml) -/- +/+ 4 8 12 16 20 Hb (g/dl) +/+ -/- 10 20 30 40 50 60 -/- +/+ Ht (%) 2 KO
 Hb (g/dl) Ht (%) 1 KO. 10. *** *** *** /+ -/- +/+ -/- +/+ -/ RBC (106/ml) -/- +/ Hb (g/dl) +/+ -/ /- +/+ Ht (%) 2 KO.")
82
Splenomegaly in AMPK1 KO mice
200 400 600 800 1000 1200 *** iron (µg/g) +/+ -/- control AMPK1-/-
 +/+ -/- control. AMPK1-/-")
83
Expression of AMPK1 isoform in RBC
control 1-/- 2-/- AMPK1 AMPK2 Exclusive expression of AMPK1 isoform in RBC = specific role for AMPK1 in RBC integrity.

84
ATP content in AMPK1 -/- RBC
900 800 700 * 600 500 400 300 200 100 +/+ -/- ATP utilization in RBC Glucose phosphorylation Phosphorylation of membrane proteins Ionic pumps

85
AMPK AMPK2 brain AMPK1 heart red blood cells adipose tissue muscle
food intake insulin sensitivity ion transport cardiac ischemia AMPK adipose tissue muscle Liver lipolysis glucose transport glycogen synthesis hepatic glucose production fatty acid metabolism

86
University of Toulouse
Institut Cochin, Paris University of Toulouse Viollet Benoit Marc Foretz Myriam Bennoun Claire Cheret Axel Kahn Sophie Vaulont Christophe Perrin Rémy Burcelin Howard Hughes Medical Institute Morris J. Birnbaum James Mu Copenhagen Muscle Research Center Sebastian B. Jørgensen Jørgen F.P. Wojtaszewski Erik A. Richter

87
Les Thiazolidinediones
Wilson TM et al, Ann Rev Biochem 2001 Moller DE et al, Int J Obes 2003

Présentations similaires


>")


 Par Juli Powers>")


