Télécharger la présentation
La présentation est en train de télécharger. S'il vous plaît, attendez

1
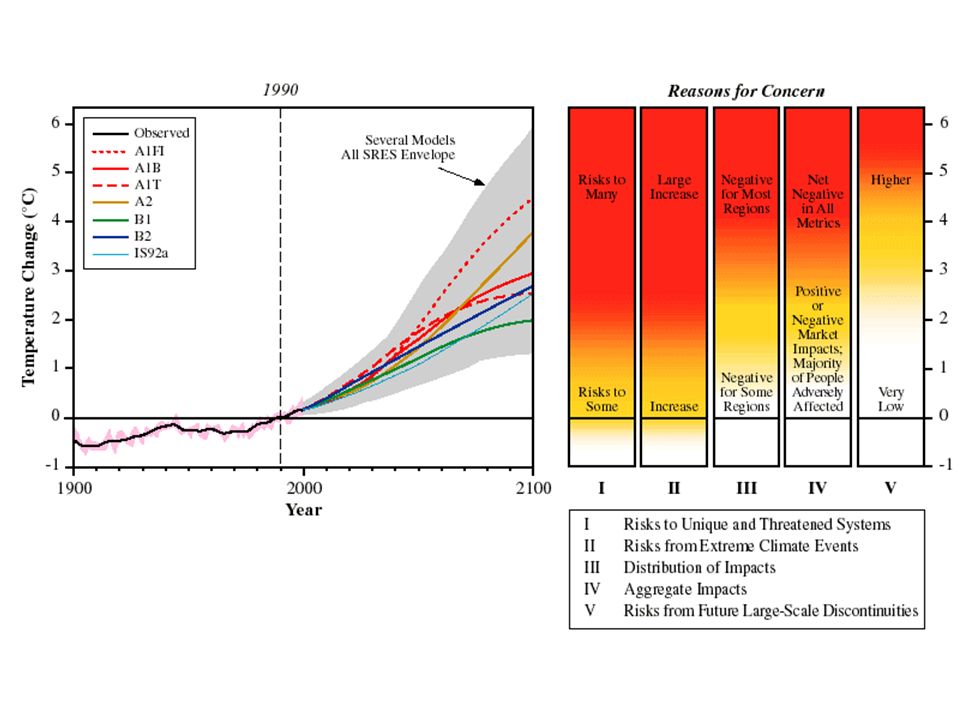
Figure SPM.3

2
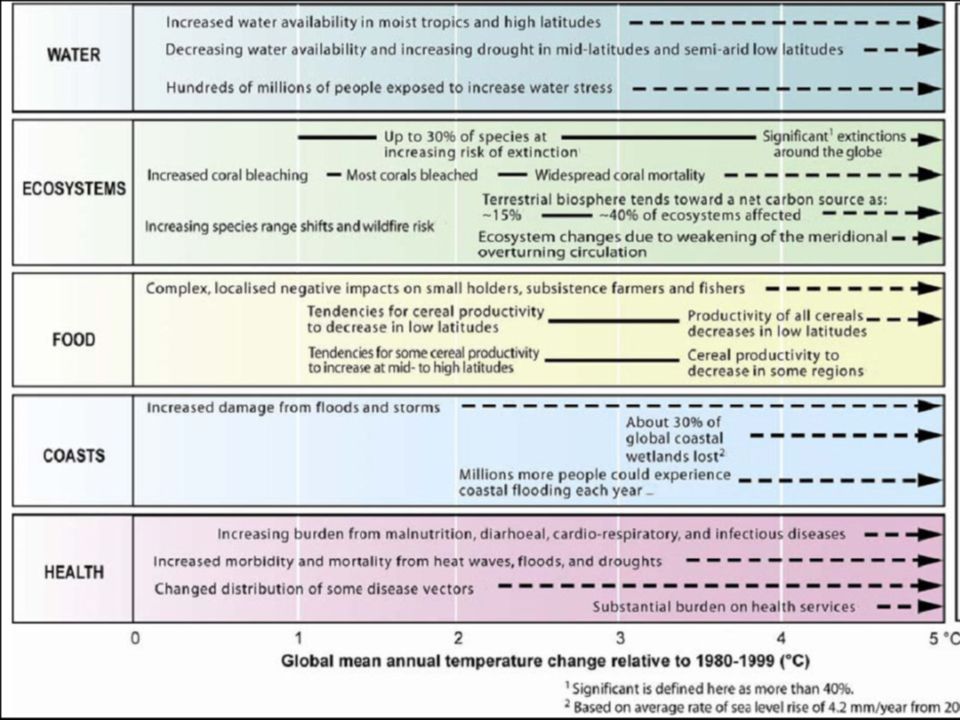
Figure TS.6

3
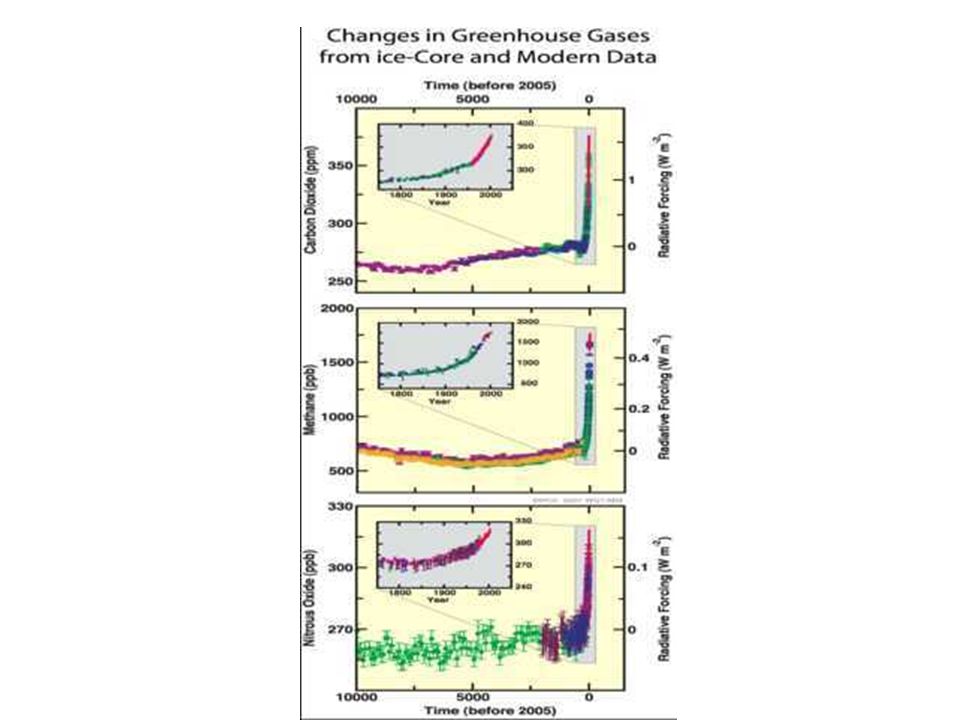
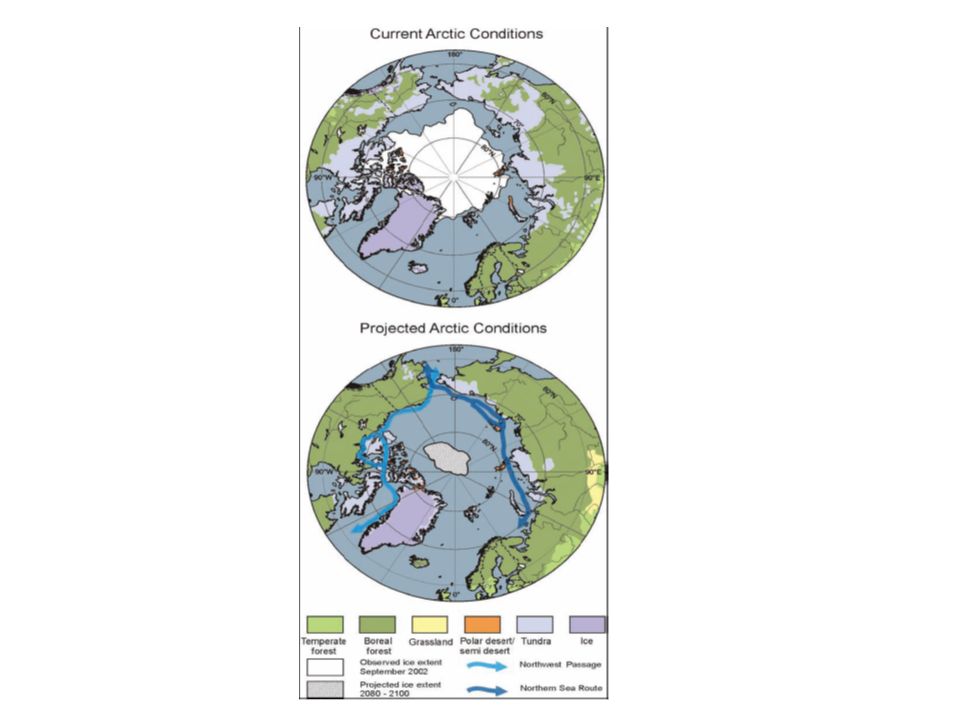
FAQ 1.3, Figure 1

4
FAQ 1.1, Figure 1

7
Figure 2.3

8
Figure TS.5

9
Figure 3.13

10
Figure 1.1

11
Better and longer satellite data about the Sun Improved assessment: a) no observed trend in solar irradiance since 1978 using high quality inter-calibrated data; b) spectral information c) solar magnetic flux model rather than proxy data; d) re-evaluation of variations in Sun-like stars. No observed trend in this data. Solar forcing much less than greenhouse gases.

12
Forçage glaciaire et réponses Last Ice age Last interglacial

13
Explosive Volcanic Eruptions: Proof of Fast-Response Climate Change Due to Forcing Changing forcing changes the temperature (and water vapor, etc.). If volcanoes can cool, then GHG must warm….

14
Figure TS.22

15
Figure TS.18

17
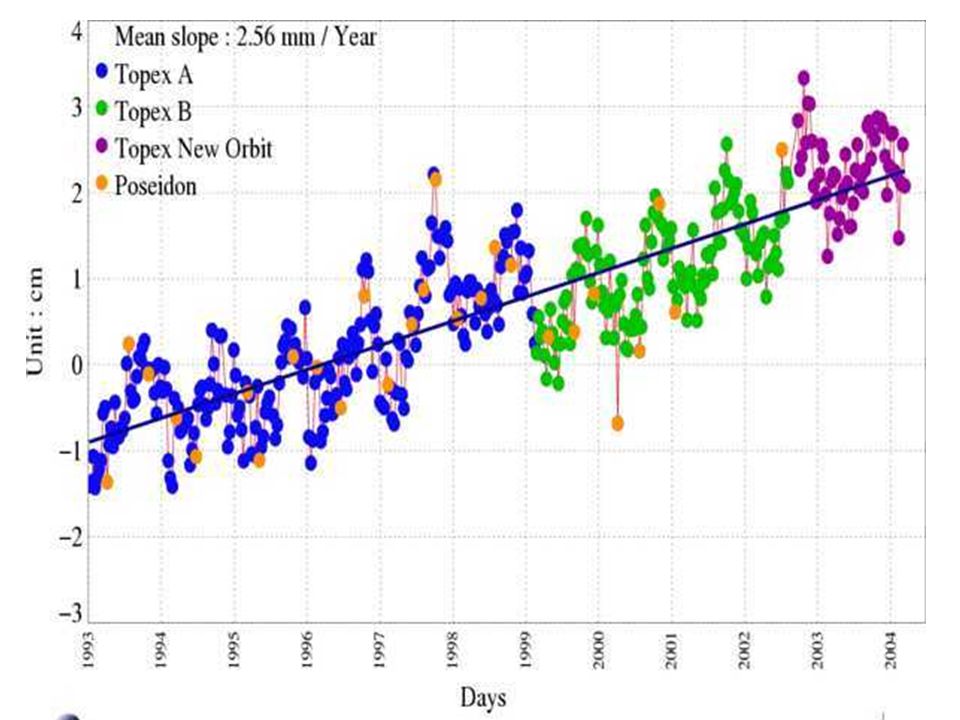
Montée du niveau de la mer 1993-2003 Dilatation thermique Glaciers & calottes glaciaires Groenland Antarctique Total Observé Observé-Total 1,6 +/-0,5 (mm/an) 0,77 +/-0,22 (mm/an) 0,21 +/-0,07 (mm/an) 0,21 +/-0,35 (mm/an) 2,8 +/-0,7 (mm/an) 3,1 +/-0.7 (mm/an) 0,3 +/-1,0 (mm/an)
 0,77 +/-0,22 (mm/an) 0,21 +/-0,07 (mm/an) 0,21 +/-0,35 (mm/an) 2,8 +/-0,7 (mm/an) 3,1 +/-0.7 (mm/an) 0,3 +/-1,0 (mm/an)")
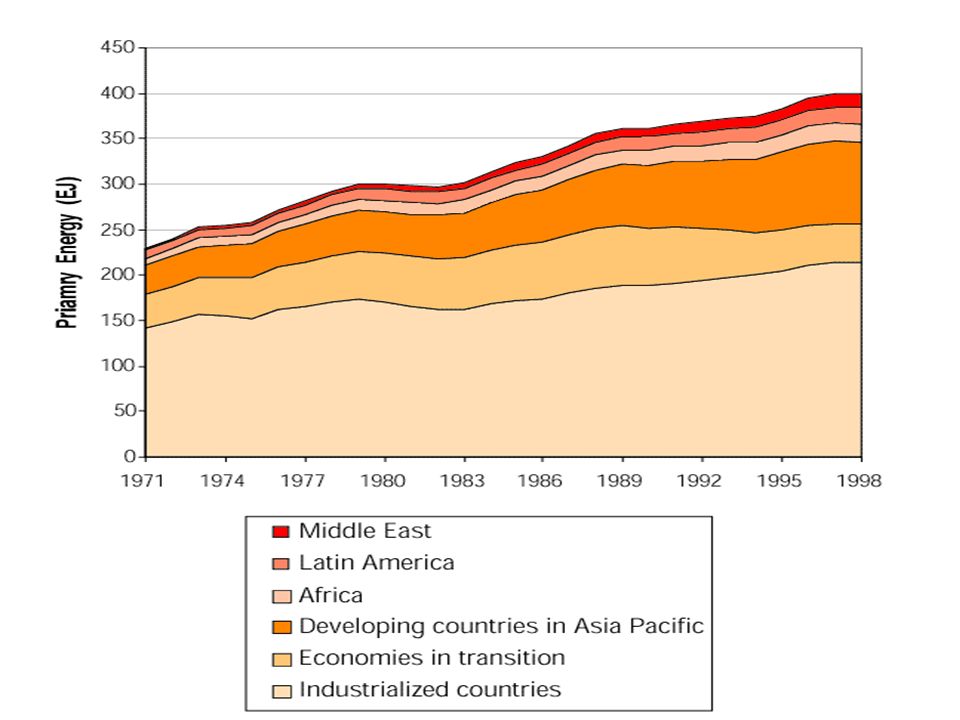
19
10 milliards de tonnes par an en « équivalent pétrole » Pétrole Gaz Charbon Bois,… Nucléaire Hydro Renouv 35% 21% 23,5% 6,8%

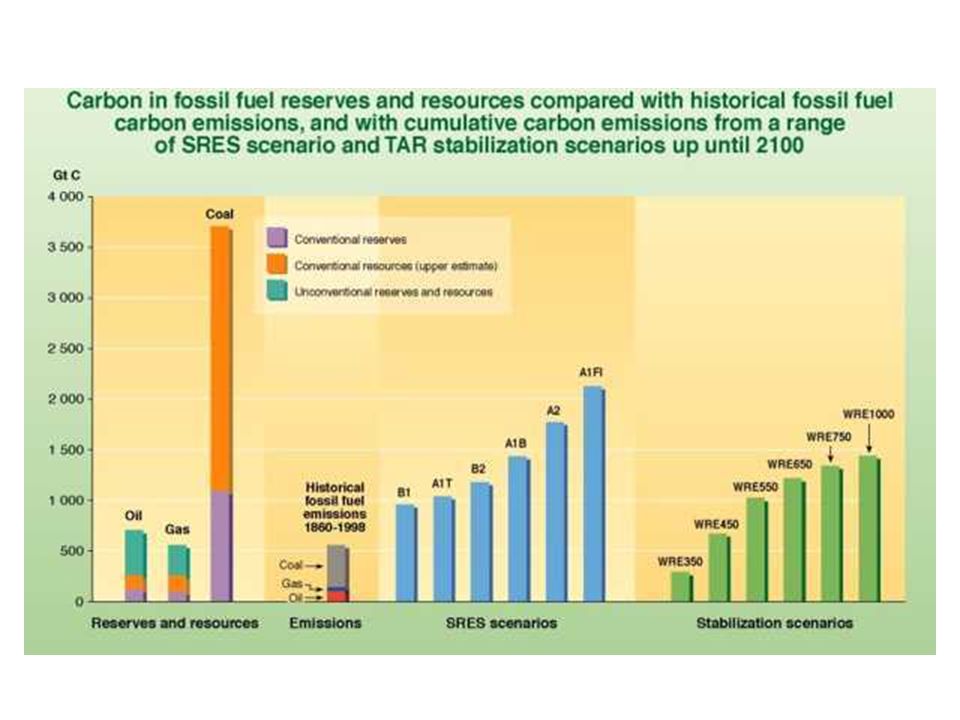
20
Les concentrations de CO 2 attendues au cours du XXIème siècle sont deux à quatre fois celles de lère préindustrielle

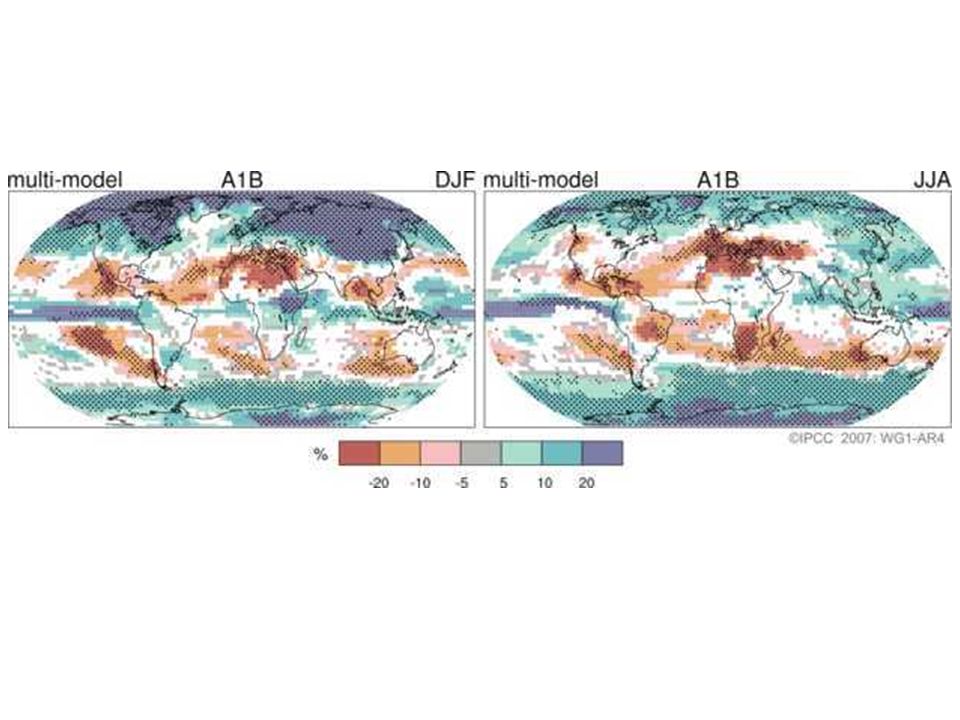
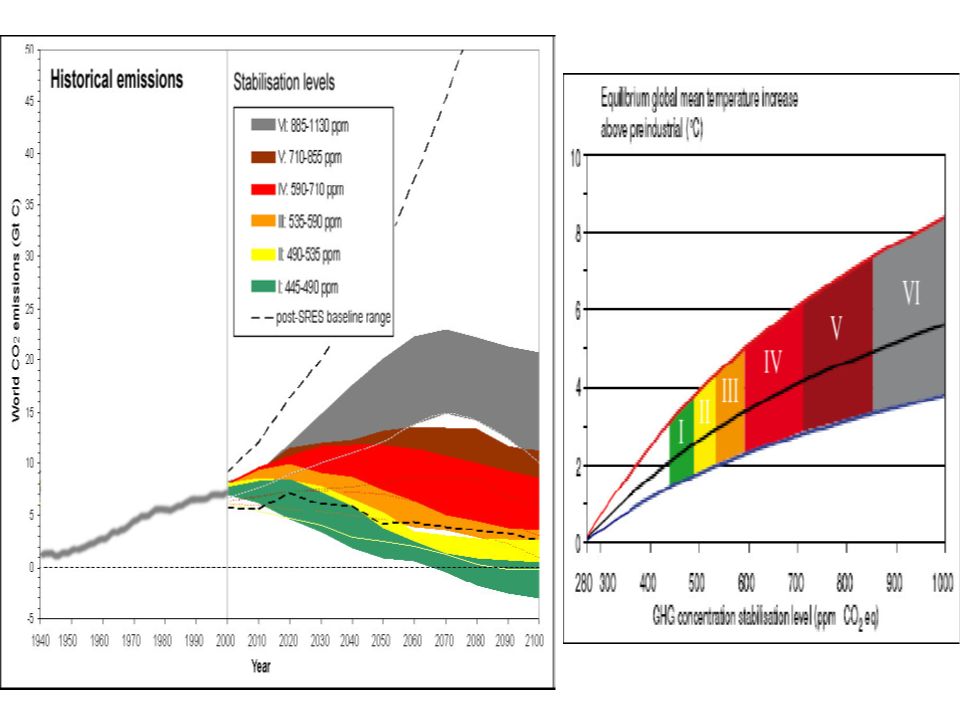
21
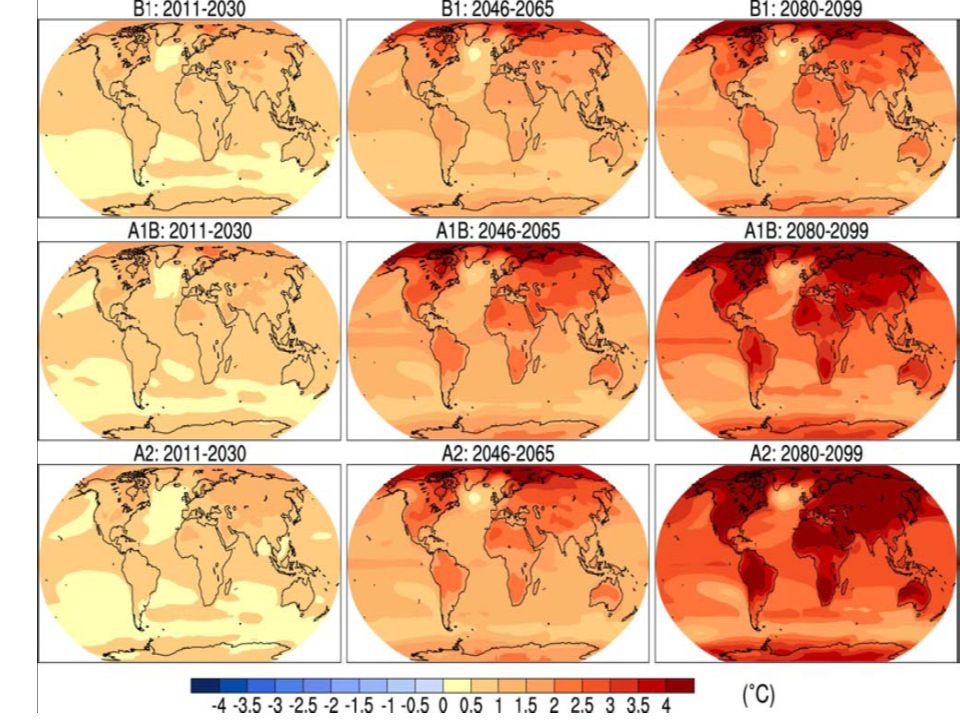
Figure SPM.5

24
Figure 11.12

29
FAQ 5.1, Figure 1

30
Deltas and megadeltas: hotspots for vulnerability Nearly 300 million people inhabit a sample of 40 deltas globally, including all the large megadeltas. Average population density is 500 people/km2 with the largest population in the Ganges-Brahmaputra delta, and the highest density in the Nile delta. Many of these deltas and megadeltas are associated with significant and expanding urban areas

32
La concentration en CO 2, la température et le niveau de la mer continuent à croître longtemps après que les émissions aient été réduites

33
La stabilisation de la concentration en gaz carbonique exige une réduction importante des émissions

Présentations similaires


>")


 mean-field (as a general theory)>")


 Nombres (1-100).>")
