Télécharger la présentation
La présentation est en train de télécharger. S'il vous plaît, attendez

1
Project Scheduling / Programmation
Remove details of WBS, PERT and GANTT; and just give an overview (recap) of each one, while explaining their complementarities; and do a full example with them. Collège militaire royal du Canada Génie électrique et génie informatique
 of each one, while explaining their complementarities; and do a full example with them. Collège militaire royal du Canada. Génie électrique et génie informatique.")
2
Outline Work Breakdown Structure (WBS) PERT Charts GANTT Charts
Wrap-up

3
Structure de répartition du travail (WBS)
Représentation hiérarchique des éléments de travail d’un projet. A work breakdown structure (WBS) in project management and systems engineering, is a deliverable oriented decomposition of a project into smaller components. It defines and groups a project's discrete work elements in a way that helps organize and define the total work scope of the project. A WBS element may be a product/Data/Service, or any combination. A WBS also provides the necessary framework for detailed cost estimating and control along with providing guidance for schedule development and control Point de départ: répartition des responsabilités Aide: Mise à l’horaire Établissement des budgets A work breakdown structure (WBS) in project management and systems engineering, is a deliverable oriented decomposition of a project into smaller components. It defines and groups a project's discrete work elements in a way that helps organize and define the total work scope of the project.[1] Hierarchical representation of work elements of a project. la mise à l’horaire = Schedule Setup Budgeting
 in project management and systems engineering, is a deliverable oriented decomposition of a project into smaller components. It defines and groups a project s discrete work elements in a way that helps organize and define the total work scope of the project. A WBS element may be a product/Data/Service, or any combination. A WBS also provides the necessary framework for detailed cost estimating and control along with providing guidance for schedule development and control. Point de départ: répartition des responsabilités. Aide: Mise à l’horaire. Établissement des budgets. A work breakdown structure (WBS) in project management and systems engineering, is a deliverable oriented decomposition of a project into smaller components. It defines and groups a project s discrete work elements in a way that helps organize and define the total work scope of the project.[1] Hierarchical representation of work elements of a project. la mise à l’horaire = Schedule Setup. Budgeting.")
4
Work Breakdown Structure (WBS)
Depicted as a tree As many layers as necessary; typically < 6 Structured around modules recently find better to synchronize with process (not with design)
")
5
Work Breakdown Structure (WBS)
")
6
WBS: Evolutionary vs. Traditionally
Evolutionary : Planning elements centered on process (not on the product) Traditionnelle : Basée sur la décomposition du produit (Liée à une conception spécifique) Système Sous-syst Mod.
 Traditionnelle : Basée sur la décomposition du produit (Liée à une conception spécifique) Système. Sous-syst. Mod.")
7
WBS : Comparaison Conventionnelle Évolutionnaire
Liée à une conception: peut nuire si changement de conception Spécifique au projet: comparaison entre projets difficile Niveau de détail difficile à cerner Évolutionnaire Liée au processus: facilite la gestion du changement Aide la comparaison entre projets Élément de travail de plus en plus précis

8
WBS : Your Project Types of WBS elements
Elaboration Collaboration Design Construction; and Management tasks You must be aware of what must be done to mitigate the risk

9
PERT Charts

10
PERT Chart Program Evaluation & Review Technique
A project management tool used to schedule, organize, and coordinate tasks within a project. A methodology developed by the U.S. Navy in the 1950s to manage the Polaris submarine missile program. The grey texts added by Dr. Beguenane

11
PERT Chart The grey texts added by Dr. Beguenane

12
Graphique PERT Autre approche: Réseau « activité-sur-nœud »
Flèches = activités Nœuds = milestones Poids de chaque flèche = durée de l’activité Graphe = dépendances d’activités Flèches divergentes = activités concurrentes Un seul nœud de départ & un seul de fin

13
Graphique PERT: Information sur le graph
Dépendances Montre relations entre les tâches Chemin critique Montre tâches pouvant retarder le projet Montre date de fin de projet (le plus tôt) Date où une tâche peut débuter le plus tard si pas sur le chemin critique, peut glisser sans affecter le chemin critique (marge de manœuvre) Shows relationships between tasks Shows tasks that can delay the project Shows date of project completion (soon) Date when a task can start as late as if not on the critical path, can slide without affecting the critical path marge de manœuvre=flexibility
 Date où une tâche peut débuter le plus tard. si pas sur le chemin critique, peut glisser sans affecter le chemin critique. (marge de manœuvre) Shows relationships between tasks. Shows tasks that can delay the project. Shows date of project completion (soon) Date when a task can start as late as. if not on the critical path, can slide without affecting the critical path. marge de manœuvre=flexibility.")
14
PERT chart using MS Visio
“Program Evaluation and Review Technique” Available: Shows relationships between tasks Shows tasks that can delay the project Shows date of project completion (soon) Date when a task can start as late as if not on the critical path, can slide without affecting the critical path marge de manœuvre=flexibility
 Date when a task can start as late as. if not on the critical path, can slide without affecting the critical path. marge de manœuvre=flexibility.")
15
PERT chart (autre exemple)
Shows relationships between tasks Shows tasks that can delay the project Shows date of project completion (soon) Date when a task can start as late as if not on the critical path, can slide without affecting the critical path marge de manœuvre=flexibility
 Date when a task can start as late as. if not on the critical path, can slide without affecting the critical path. marge de manœuvre=flexibility.")
16
Graphique PERT: Pour & Contre
+ On voit bien les dépendances Chemin critique est apparent - Calculs sont difficiles à faire Des logiciels sont disponibles pour aider L’information n’est pas toujours facile à dériver du graphique

17
GANTT Charts

18
Graphique GANTT Nommé selon son inventeur Henry Laurence Gantt (Ingénieur en Mécanique Américain) Démontre la durée d’une activité contre un calendrier Dépendances indiquées par les temps de début/fin (et des flèches) Shows the duration of activity against a schedule
 Shows the duration of activity against a schedule.")
19
GANTT Chart Useful tool for planning and scheduling projects.
Helpful when monitoring a project's progress. Type of bar chart that illustrates a project schedule. Illustrates the start/finish dates of the terminal elements and summary elements of a project.

20
GANTT Chart Terminal elements and summary elements in the Gantt charts comprise the WBS (Work Breakdown Structure) of the project. Some Gantt charts also show the dependency relationships between activities. Gantt charts can be used to show current schedule status using percent-complete shadings and a vertical "Today" line.

21
GANTT Chart Planning and Scheduling
Use a Gantt chart to plan how long a project should take. A Gantt chart lays out the order in which the tasks need to be carried out. Early Gantt charts did not show dependencies between tasks but modern Gantt chart software provides this capability. Source:

22
GANTT Chart Monitoring a Project
A Gantt chart lets you see immediately what should have been achieved at any point in time. A Gantt chart lets you see how remedial action may bring the project back on course. Most Gantt charts include "milestones" which are not part of a traditional Gantt Chart. However, for representing deadlines and other significant events, it is very useful to include this feature on a Gantt chart. Source:

23
GANTT Chart Depicts any slack time of a task
activities without slack time are on the critical path Milestones are shown as zero length “events” e.g. delivery of a design document Dépeint tout moment mou d'une tâche Les jalons sont montré que la longueur zéro "événements"

24
Activités du chemin critique
Graphique GANTT Activités du chemin critique Jours 5 10 15 20 25 30 On peut indiquer les activités complétées Début le plus tard (22) Gagne le contrat Interview usagers Création plan test Conception Int Codage Int Test Int Party 5 Des flèches peuvent être utilisées pour montrer la précédence 5 Marge 5 Qu’est-ce qui arrive si ces tâches doivent être accomplies par la même personne? 7 15 3 1
 Gagne le contrat. Interview usagers. Création plan test. Conception Int. Codage Int. Test Int. Party. 5. Des flèches peuvent. être utilisées pour montrer. la précédence. 5. Marge. 5. Qu’est-ce qui arrive si ces tâches doivent être accomplies par la même personne")
25
GANTT Chart - Pros & Cons
Shows timeline, and progress, clearly Not all dependencies are clearly defined Again, tools help...

26
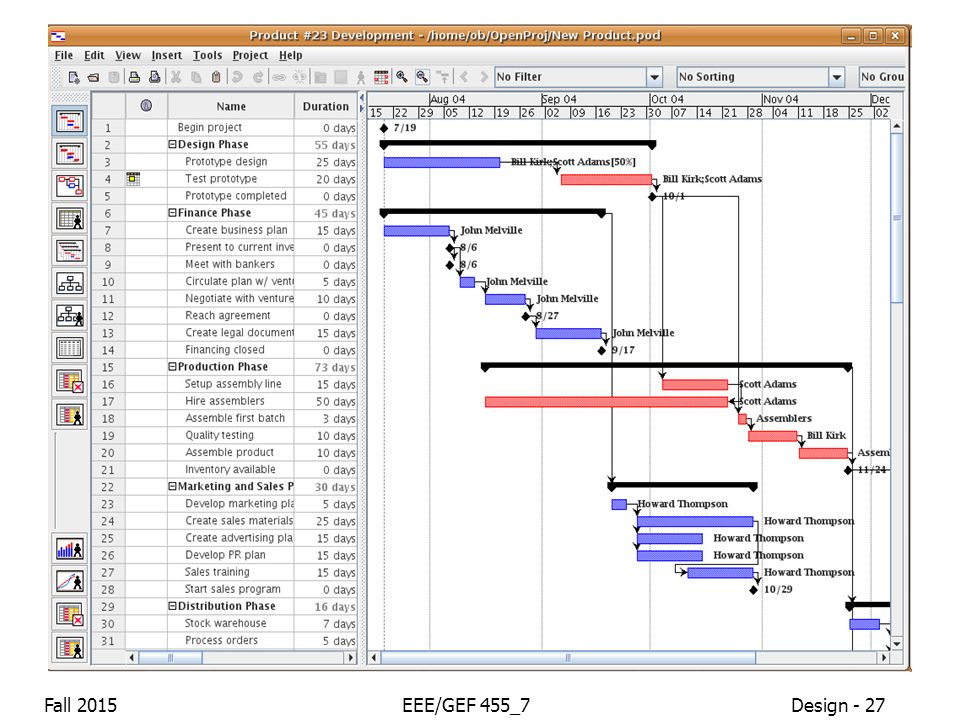
Graphique GANTT : Logiciels de support
Plusieurs logiciels existent pour aider à la programmation Projex Excel add-in ( OpenProj (openproj.org/openproj)
")
28
Next Point Work Breakdown Structure (WBS) PERT Charts GANTT Charts
Wrap-up

29
Application à votre projet
Vous devez soumettre un horaire de votre projet sous forme d’un graphique Gantt Vous devez connaître les activités sur votre chemin critique Vous saurez ainsi si votre projet glisse Vous saurez quelles tâches sont plus importantes Gardez tout à date pour contrôler le déroulement You'll know if your project slips You will know which tasks are more important Keep everything to date to monitor the progress You must submit a schedule of your project as a Gantt chart

30
Your timeline If you estimate a task will take you “one day” - how do you put this in your Gantt chart? do you mean one project day (i.e. 4 hours) do you mean one full work day/weekend (i.e. 8hours) Be wary of double tasking Mid-terms Christmas Break Reading Week Ordering/Receiving parts is almost always on the critical path Méfiez-vous des tâches doubles Commande / Réception des pièces est presque toujours sur le chemin critique
 do you mean one full work day/weekend (i.e. 8hours) Be wary of double tasking. Mid-terms. Christmas Break. Reading Week. Ordering/Receiving parts is almost always on the critical path. Méfiez-vous des tâches doubles. Commande / Réception des pièces est presque toujours sur le chemin critique.")
31
Example Project AFFIDS: The Autonomous Forest Fire Identification and Detection System By: James Hodgson & Grant Greaves Project Number: 455_ Supervisor: Dr. Rachid Beguenane Academic Year: 2010/2011 Objectif: The AFFIDS is a nearly-autonomous aerial system meant to identify and communicate the location of forest fires to a ground-based control station, which can then relay this information to crucial forest-fire-fighting entities in near-real time. Possible solution: Use of a small CMOS camera onboard an autonomous Unmanned Aerial Vehicle (UAV), the AFFIDS transmits a wireless video signal to a receiver in the ground control station (GCS). The feed is then analyzed either automatically by an FPGA or manually by a user through a PS/2 mouse input and an LCD monitor, and the location of targets are then transmitted when required. wiring harness loaded onboard the UAV = câblage chargée embarqué sur le drone
, the AFFIDS transmits a wireless video signal to a receiver in the ground control station (GCS). The feed is then analyzed either automatically by an FPGA or manually by a user through a PS/2 mouse input and an LCD monitor, and the location of targets are then transmitted when required. wiring harness loaded. onboard the UAV = câblage chargée embarqué sur le drone.")
32
Example Project AFFIDS: The Autonomous Forest Fire Identification and Detection System By: James Hodgson & Grant Greaves Project Number: 455_ Supervisor: Dr. Rachid Beguenane Academic Year: 2010/2011 Proposed PDS Batteries and power supplies required to power each subsystem and module Camera, transmitter, antenna and wiring harness loaded onboard the UAV responsible for the capture and transmission of the video feed. wiring harness loaded onboard the UAV = câblage chargée embarqué sur le drone FPGA responsible for the decoding, analysis and encoding of the video signal as well as processing mouse input Receiver(s), antenna(s) and the video distribution module which serve to receive the wireless video signal Viewing the output video signal.
, antenna(s) and the video distribution module which serve to receive the wireless video signal. Viewing the output video signal.")
33
Example Proposed Gantt Chart
Project AFFIDS: The Autonomous Forest Fire Identification and Detection System By: James Hodgson & Grant Greaves Project Number: 455_ Supervisor: Dr. Rachid Beguenane Academic Year: 2010/2011 Proposed Gantt Chart

34
Référence supplémentaire
Walker Royce. Software Project Management - A Unified Framework, Chapter 10. Addison Wesley, ISBN

35
Question?

Présentations similaires


 DAYS OF THE.>")


 Association franco-ontarienne.>")


 ÉCOLE POLYTECHNIQUE FÉDÉRALE DE LAUSANNE 1 Petri nets for.>")


: You will make an oral presentation to your class on a specific.>")

