Télécharger la présentation
La présentation est en train de télécharger. S'il vous plaît, attendez

1
Analyse de la covariance
ANCOVA ANCOVA as statistical control Ancova is a way to adjust the experimental groups after the fact, so that the results can be interpreted as though a nuisance variable X had been held constant across groups. The main purpose af the analysis of covariance is statistical control of variability when experimental control can not be used. It is a statistical method for reducing experimental error or for removing the effect of an extraneous variable. Statistical control is obtained by using a concomitant variable (called the covariate) along with the dependent variable. The analysis of covariance makes use of linear prediction or regression as described in chapter one under "Linear Prediction." The underlying rational for the analysis of covariance is the idea of using prediction equations to predict the values (scores and means) of the dependent variable on the basis of the values of the covariate variable, and then subtracting these predicted scores and means from the corresponding values of the dependent variable. Oversimplifying a bit, the analysis of covariance is like an analysis of variance on the residuals of the values of the dependent variable, after removing the influence of the covariate, rather than on the original values themselves. In so far as the measures of the covariate are taken in advance of the experiment and they correlate with the measures of the dependent variable they can be used to reduce experimental error (the size of the error term) or control for an extraneous variable by removing the effects of the covariate from the dependent variable. Winer gives the following examples: The variate in this experiment may be a measure of extinction: the covariate may be a measure associated with the degree of learning at the start of the extinctin trials. As another example, suppose that the purpose of an experiment is to measure the effect of various stress situations upon blood pressure. In this case a measure of blood pressure under a condition of no stress may be the covariate. As still another example, suppose that the purpose of an experiment is to evaluate the effect of electrical stimulation on the weight of denervated muscle. The weight of the corresponding normal muscle may serve as a covariate in this type of experiment. (Winer, p. 578)
 along with the dependent variable. The analysis of covariance makes use of linear prediction or regression as described in chapter one under Linear Prediction. The underlying rational for the analysis of covariance is the idea of using prediction equations to predict the values (scores and means) of the dependent variable on the basis of the values of the covariate variable, and then subtracting these predicted scores and means from the corresponding values of the dependent variable. Oversimplifying a bit, the analysis of covariance is like an analysis of variance on the residuals of the values of the dependent variable, after removing the influence of the covariate, rather than on the original values themselves. In so far as the measures of the covariate are taken in advance of the experiment and they correlate with the measures of the dependent variable they can be used to reduce experimental error (the size of the error term) or control for an extraneous variable by removing the effects of the covariate from the dependent variable. Winer gives the following examples: The variate in this experiment may be a measure of extinction: the covariate may be a measure associated with the degree of learning at the start of the extinctin trials. As another example, suppose that the purpose of an experiment is to measure the effect of various stress situations upon blood pressure. In this case a measure of blood pressure under a condition of no stress may be the covariate. As still another example, suppose that the purpose of an experiment is to evaluate the effect of electrical stimulation on the weight of denervated muscle. The weight of the corresponding normal muscle may serve as a covariate in this type of experiment. (Winer, p. 578)")
2
Exemple

3
Modèle général linéaire de l’ANCOVA
[valeur observée] = grande moyenne + [effet du traitement] + [effet de la variable covariée] + [erreur] ou: Xij = µ + i + ß(Yij-Y.) + eij Hypothèse nulle µ*1 = µ*2 = µ*3 = µ* à la place de µ1 = µ2 = µ3 = µ More than one covariate One can use more than one covariate. However, one needs to take into account that the assumption of homogenity of regression becomes the assumption of equivalence of the variance-covariance matrices. (This can be tested using the BOX M test, however this test is sensitive to violations of normality) Also we need to assume multivariate normality :-) Further, the problem of multicolinarity arises -> see MR
 + eij. Hypothèse nulle. µ*1 = µ*2 = µ*3 = µ* à la place de. µ1 = µ2 = µ3 = µ. More than one covariate. One can use more than one covariate. However, one needs to take into account that the assumption of homogenity of regression becomes the assumption of equivalence of the variance-covariance matrices. (This can be tested using the BOX M test, however this test is sensitive to violations of normality) Also we need to assume multivariate normality :-) Further, the problem of multicolinarity arises -> see MR.")
4
La répartition des variances
Pour X: Pour Y: Pour la régression de X et Y

5
Les variances ajustées

6
Exemple de calcul Sommes des carrées X (pretest)
SCTotale=( )2 + ( ) )2 = 240 SCInter= (9)[( )2 + ( )2 + ( )2] = 114 SCIntra=(5 - 7)2 + (4 - 7) ( )2 = 126 Sommes des carrées Y (posttest) SCTotale =( )2 + ( ) ( )2 = 276 SCInter= (9)[( )2 + ( )2 + ( )2] = 6 SCIntra=( )2 + ( ) ( )2 = 270 Sommes des produits XY SCTotale= ( )( ) + ( )( ) + ( )( ) = 184 SCInter=(9)[( )( ) + ( )( ) + ( )( )] = 21 SCIntra=(5 - 7)( ) + (4 - 7)( ) + ( )( ) = 163
2 + ( ) )2 = 240. SCInter= (9)[( )2 + ( )2 + ( )2] = 114. SCIntra=(5 - 7)2 + (4 - 7) ( )2 = 126. Sommes des carrées Y (posttest) SCTotale =( )2 + ( ) ( )2 = 276. SCInter= (9)[( )2 + ( )2 + ( )2] = 6. SCIntra=( )2 + ( ) ( )2 = 270. Sommes des produits XY. SCTotale= ( )( ) + ( )( ) ( )( ) = 184. SCInter=(9)[( )( ) + ( )( ) + ( )( )] = 21. SCIntra=(5 - 7)( ) + (4 - 7)( ) ( )( ) = 163.")
7
Sommes des carrées ajustées

8
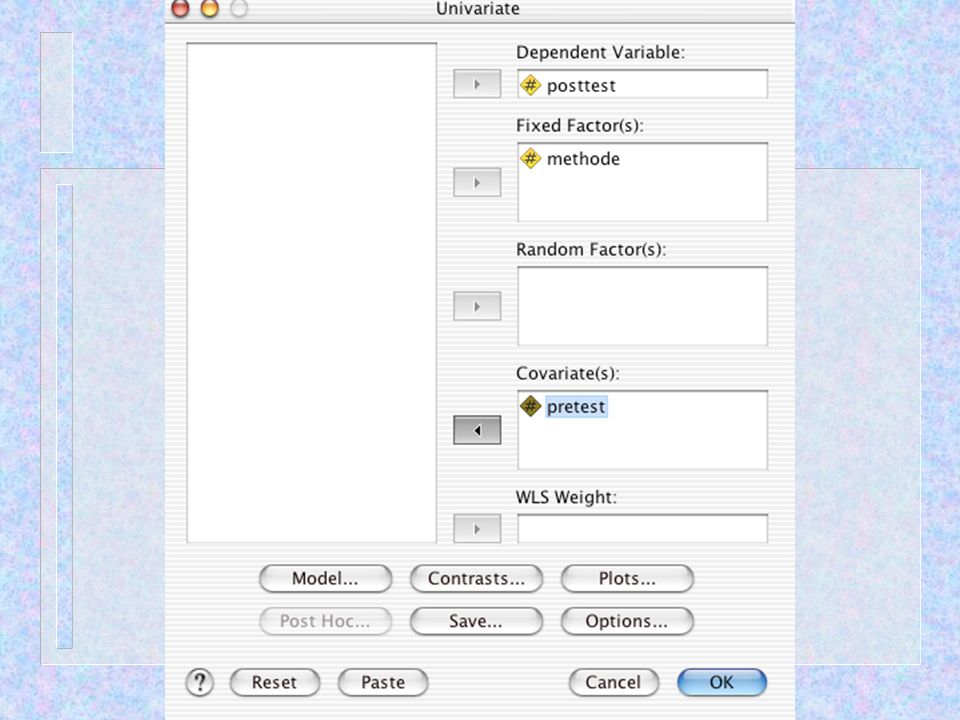
SPSS

10
Moyennes ajustées

12
Postulats Indépendance des observations Homogénéité de la variance
Normalité dans la population Homogénéité des pentes de régression

13
Homogénéité des pentes de régression
If the regression slopes are not parallel we can NOT use ANCOVA Alternatives blocking matching difference scores

14
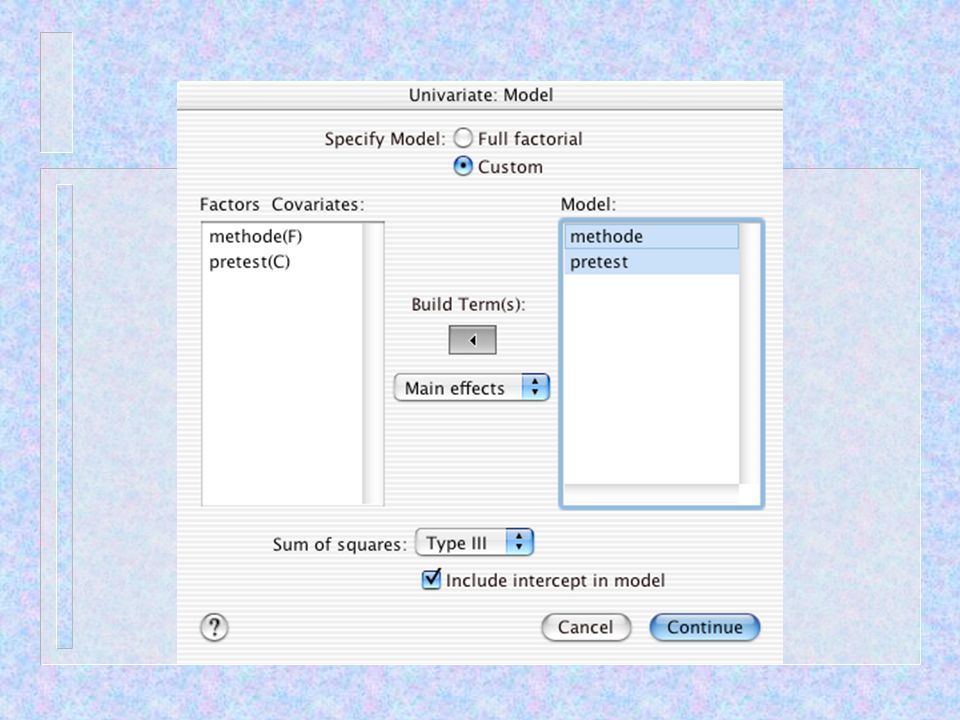
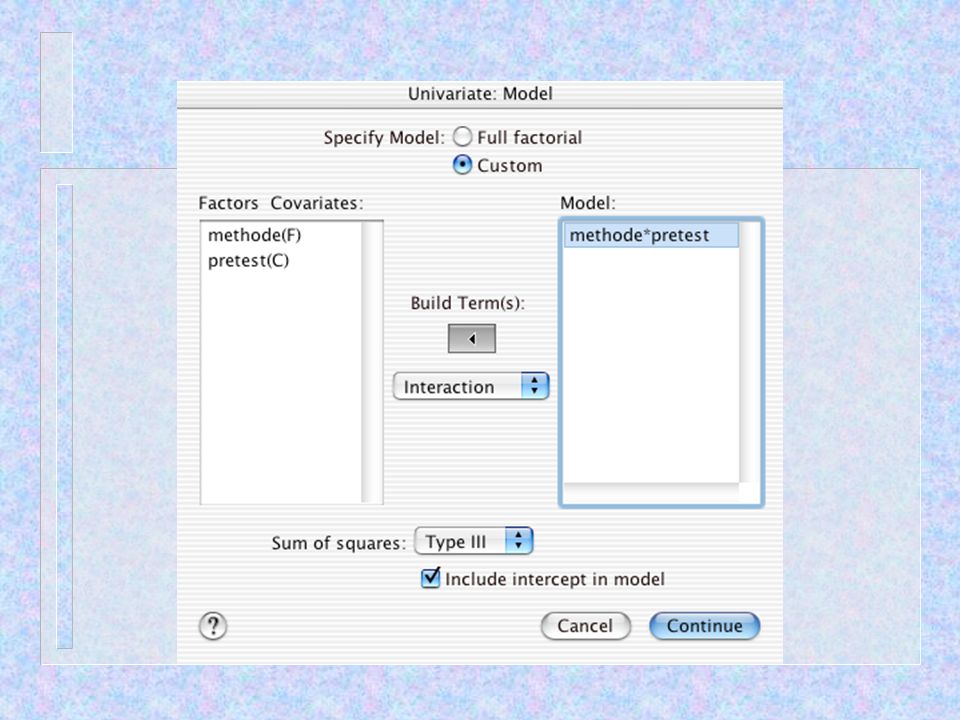
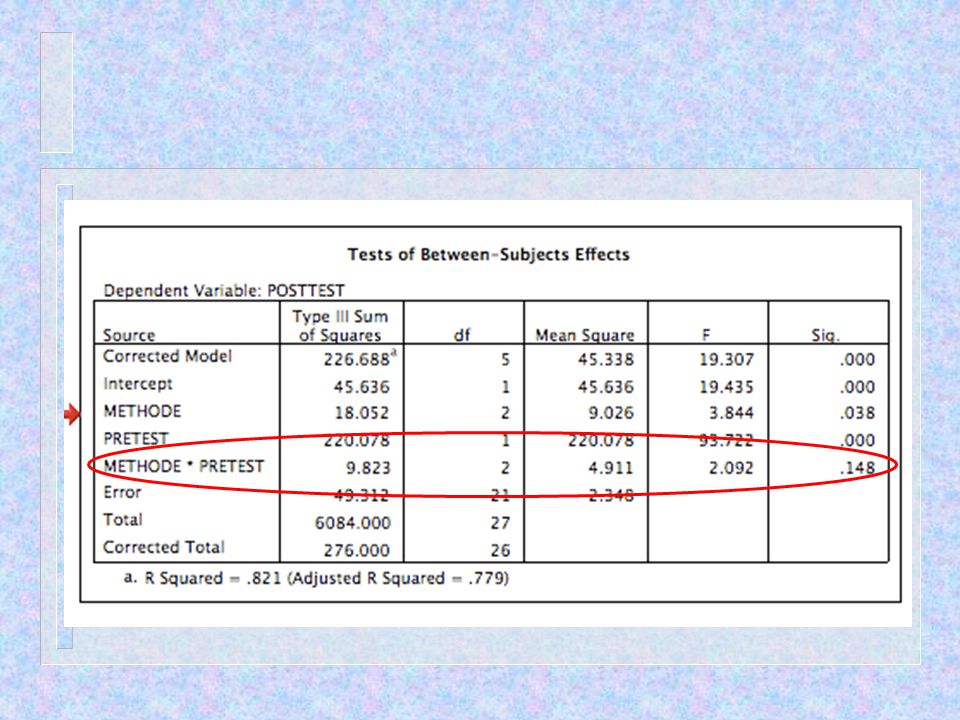
Vérification de l’homogénéité des pentes de régression

18
Médiation

19
Sources d’association entre deux ou plusieurs variables
Effets causaux Effets non causaux Effets directs Effets indirects Anteced. partagées Ass. non analysées

20
Variable indépendante
Modèle de médiation Variable médiatrice a b Variable indépendante Variable dépendante t’ Effet direct = t’ Effet indirect = ab Effet total = t’+ ab

21
Il y a médiation quand … (Baron & Kenny, 1986)
L’effet direct de la variable indépendante sur la variable dépendante (t’) est significatif. Le chemin de la VI à la variable médiatrice (a) est significatif. Le chemin de la variable médiatrice à la VD (b) est significatif. Il y a médiation totale quand: Après contrôle de la variable médiatrice l’effet directe de la VI sur la VD (t’) devient non significatif.
 est significatif. Le chemin de la VI à la variable médiatrice (a) est significatif. Le chemin de la variable médiatrice à la VD (b) est significatif. Il y a médiation totale quand: Après contrôle de la variable médiatrice l’effet directe de la VI sur la VD (t’) devient non significatif.")
22
Exemple Effet direct = t’=.42 Effet indirect = ab = .12
Effet après contrÔle de la variable médiatrice: .30

23
Vérification du chemin ab
Test l’hypothèse que ab = 0 de Goodman (1960) avec a le coefficient non standardisé de la régression de la VM sur la VI b le coefficient non standardisé de la régression de la VD sur la VM (en contrÔlant pour la VI) sa erreur type de a = a/ta sb erreur type de b = b/tb Site avec calculatrice pour le test:
 avec. a le coefficient non standardisé de la régression de la VM sur la VI. b le coefficient non standardisé de la régression de la VD sur la VM (en contrÔlant pour la VI) sa erreur type de a = a/ta. sb erreur type de b = b/tb. Site avec calculatrice pour le test:")
24
Exemple SPSS Calcul de t’

25
Calcul de a a = .41, sa = .164

26
Calcul de b b = .40, sb = .096 Effet apès contrÔle de la
variable médiatrice: .30

27
Test de Goodman b = .40 sb = .096 a = .41 sa = .164
Different versions of the above variance have been published. Sobel (1982) presents the above formula without the last term. Baron and Kenny (1986) present the above formula with the last term added, not subtracted. That formula is a population formula whereas the Goodman formula is the sample-based estimate. The Sobel formula is an approximation.
 presents the above formula without the last term. Baron and Kenny (1986) present the above formula with the last term added, not subtracted. That formula is a population formula whereas the Goodman formula is the sample-based estimate. The Sobel formula is an approximation.")
28
Ressources Site web de David Kenny Site web de Kristopher Preacher
Site web de David Kenny MacKinnon, D. P., Lockwood, C. M., Hoffman, J. M., West, S. G., & Sheets, V. (2002). A comparison of methods to test mediation and other intervening variable effects. Psychological Methods, 7, Judd, C. M., Kenny, D. A., & McClelland, G. H. (2001). Estimating and testing mediation and moderation in within - subject designs. Psychological Methods, 6,
. A comparison of methods to test mediation and other intervening variable effects. Psychological Methods, 7, Judd, C. M., Kenny, D. A., & McClelland, G. H. (2001). Estimating and testing mediation and moderation in within - subject designs. Psychological Methods, 6,")
Présentations similaires

 r =>")
>")


Définition Un test cest une méthode qui permet de prendre une décision à partir des résultats dun échantillon.>")


 Michel Tenenhaus.>")


