Télécharger la présentation
La présentation est en train de télécharger. S'il vous plaît, attendez

1
ISO /TC207 Member Workshop, Bangkok June 25th, 2012 Environmental Performance and Corporate Carbon Footprints by Jean-Pierre TABET Convenor of SC7/WG3

2
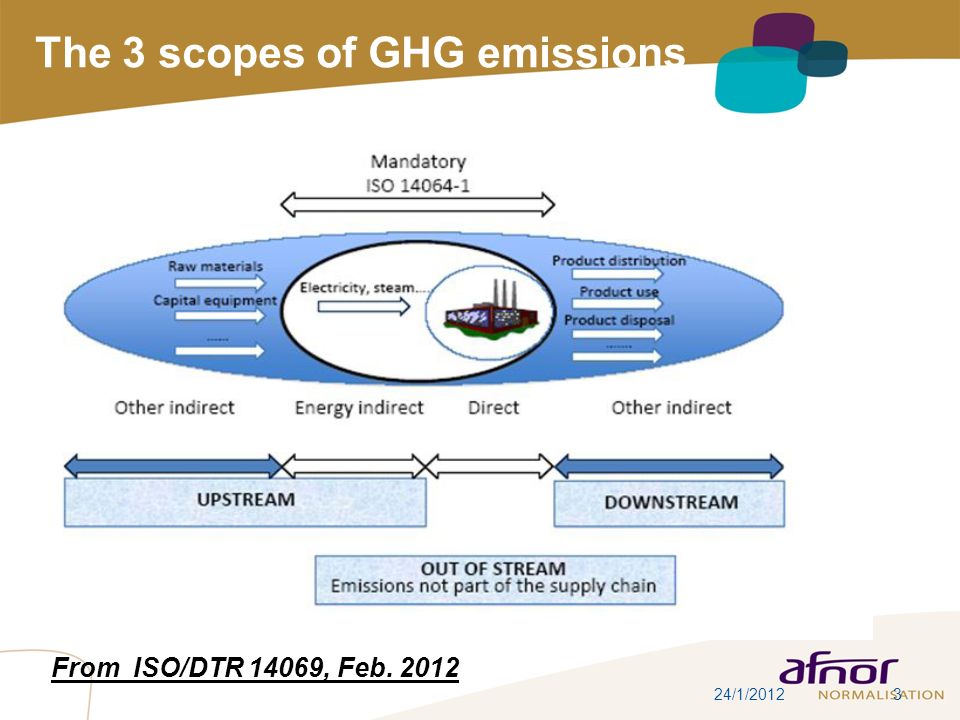
1 / Pour personnaliser les références : Affichage / En-tête et pied de page Personnaliser la zone Pied de page, Faire appliquer partout ISO Standard for Corporate Carbon Footprint ISO 14064-1 (2006) 14064-1 Requirement Mandatory quantification and reporting of all relevant GHG emissions from : Direct sources, i.e. inside organizational boundaries (= scope 1) Energy indirect sources, i.e. electricity and heat generation, outside organizational boundaries (= scope 2) 14064-1 Recommendation Recommended quantification and reporting of : Other indirect sources : from upstream and downstream activities, e.g. carbon embedded in bought products, transport emissions, wate disposal, … (= scope 3) DTR 14069 (in progress) Guidance for 14064-1, quantification and reporting Provides methodologies for all types of emissions Particular attention to scope 3 emissions methodologies
 Energy indirect sources, i.e. electricity and heat generation, outside organizational boundaries (= scope 2) Recommendation Recommended quantification and reporting of : Other indirect sources : from upstream and downstream activities, e.g. carbon embedded in bought products, transport emissions, wate disposal, … (= scope 3) DTR (in progress) Guidance for , quantification and reporting Provides methodologies for all types of emissions Particular attention to scope 3 emissions methodologies.")
3
1 / Pour personnaliser les références : Affichage / En-tête et pied de page Personnaliser la zone Pied de page, Faire appliquer partout The 3 scopes of GHG emissions 324/1/2012 From ISO/DTR 14069, Feb. 2012
4
1 / Pour personnaliser les références : Affichage / En-tête et pied de page Personnaliser la zone Pied de page, Faire appliquer partout Environmental Performance and Carbon Performance Often in the same direction …. Air quality Biodiversity ….. But not always ! Particles inside atmosphere decrease greenhouse effect (about) no carbon nuclear plants generate water eutrophisation. The old dilemma multi-criteria versus mono –criteria A good directed action for one criteria may be very bad for many other criteria Mono-criteria is partial, but (too much?) easier to use and report Difficult comparison of multi-criteria SETAC (Society of Environmental Toxicology and Chemistry) in 2006 : « Oversimplified methods may disinform stakeholders about the environmental implications of products and services and thereby lead to counterproductive results for the environment »
 no carbon nuclear plants generate water eutrophisation. The old dilemma multi-criteria versus mono –criteria A good directed action for one criteria may be very bad for many other criteria Mono-criteria is partial, but (too much ) easier to use and report Difficult comparison of multi-criteria SETAC (Society of Environmental Toxicology and Chemistry) in 2006 : « Oversimplified methods may disinform stakeholders about the environmental implications of products and services and thereby lead to counterproductive results for the environment ».")
5
1 / Pour personnaliser les références : Affichage / En-tête et pied de page Personnaliser la zone Pied de page, Faire appliquer partout Carbon Footprint for Corporate Environmental Performance. EVALUATE CARBON ENVIRONMENTAL PERFORMANCE IN ORDER TO : Identify corporate risks and opportunities Future regulations (mandatory mitigation, taxes, carbon price) Corporate image Investors’ attitudes and decisions Conduct carbon emissions reductions (directed actions) Inside organization From upstream and downstream activities Construct strategic responses Orientation of activities Choice of suppliers Choice of markets Scope 3 helps a lot !
 Corporate image Investors’ attitudes and decisions Conduct carbon emissions reductions (directed actions) Inside organization From upstream and downstream activities Construct strategic responses Orientation of activities Choice of suppliers Choice of markets Scope 3 helps a lot !.")
6
1 / Pour personnaliser les références : Affichage / En-tête et pied de page Personnaliser la zone Pied de page, Faire appliquer partout Carbon Disclosure Project : Major corporates choose Scope 3 Global 500 are Fortune’ annual ranking for world’s biggest companies

7
1 / Pour personnaliser les références : Affichage / En-tête et pied de page Personnaliser la zone Pied de page, Faire appliquer partout Scope 3 illustration : IKEA (22,000 m2 furniture store, around Paris) Clients’ transportation Products’ transportation Services and office supplies Light, warming and cooling Scope 3 (att. : without embedded carbon in furniture ! ) Scope 1 & 2
 Scope 1 & 2.")
8
1 / Pour personnaliser les références : Affichage / En-tête et pied de page Personnaliser la zone Pied de page, Faire appliquer partout Scope 3 illustration : Banana Industry (1/2) French West Indies, 2009 figures Maturity Process Road Transportation Cooling & preservation Sea Transportation UGPBAN Wrapping Cultivation Insecticids Fertilizers Global results, disagregation by sub-sector 922 kgCO2e per ton of banana, ± 210
 French West Indies, 2009 figures Maturity Process Road Transportation Cooling & preservation Sea Transportation UGPBAN Wrapping Cultivation Insecticids Fertilizers Global results, disagregation by sub-sector 922 kgCO2e per ton of banana, ± 210")
9
1 / Pour personnaliser les références : Affichage / En-tête et pied de page Personnaliser la zone Pied de page, Faire appliquer partout Scope 3 illustration : Banana Industry (2/2) French West Indies, 2009 figures Global results, disagregation by TR 14069 GHG emission categorie ……… and still 922 kgCO2e per ton of banana, ± 210 ………
 French West Indies, 2009 figures Global results, disagregation by TR GHG emission categorie ……… and still 922 kgCO2e per ton of banana, ± 210 ………")
10
1 / Pour personnaliser les références : Affichage / En-tête et pied de page Personnaliser la zone Pied de page, Faire appliquer partout Conclusions Environmental performance indicators are needed by companies : risks & opportunities, mitigation, strategy Corporate environmental performance may use Organization Carbon Footprint as one of important indicators. Best is to use complete scope 1, 2 & 3 GHG emissions inventories. More opened opportunities, monitored risks, directed actions. Big companies already use scope 3 approach Ideas to improve Carbon Environmental Performance: Revision of 14064-1, with, among others, scope 3 requirements Carbon management standards

Présentations similaires


 CapVol Method Mémoire soutenu en.>")


 Association franco-ontarienne.>")


