Télécharger la présentation
La présentation est en train de télécharger. S'il vous plaît, attendez

1
Urban environment and health
Perspectives in Montreal: Examples in transportation, physical activity and food security Lise Bertrand, Anne Pelletier and François Thérien McGill Institute of Health and social policy, April 14, 2010

2
Mandate of the Montréal Public Health Department
Inform the population on such issues as their state of health, priority health problems, vulnerable groups, risk factors and efficient interventions Follow the evolution of the public’s health and conduct appropriate research Ensure that the required preventive measures are adopted by the appropriate authorities

3
Objective of the presentation
To illustrate how the Montréal Public Health Department is working to improve the health of the Montréal population by acting on the built environment

4
The built environment: a definition
Land use (spatial distribution of functions and uses) Design of buildings and public places The transportation system: infrastructures, equipment, rolling stock, policies and service provision Source: Handy, Boarnet, Ewing and Killingsworth, 2002
 Design of buildings and public places. The transportation system: infrastructures, equipment, rolling stock, policies and service provision. Source: Handy, Boarnet, Ewing and Killingsworth,")
5
Vision of the urban environment and health sector
Montréal is a city where Indoor and outdoor air are of good quality Housing is accessible, affordable, adapted, healthy and safe and takes into account the needs of the vulnerable population Urban planning promotes safe active transportation and promotes mixity of functions and accessibility to local services Public transit allows for less dependence on the automobile and is accessible for all Green spaces are available for all Healthy food is accessible within walking distance of homes

6
Food environment, food security Why are we interested in food system ?
We give the broad perspective of WHO to Food security definition, which deals with agriculture methods as well as with food transportation or people’s capacity to buy it. We observe the food environment, and food consumption, from a health perspective. We are precisely interested in Montreal food system which has its own personality

7
Inequalities in the food environment inequalities in health
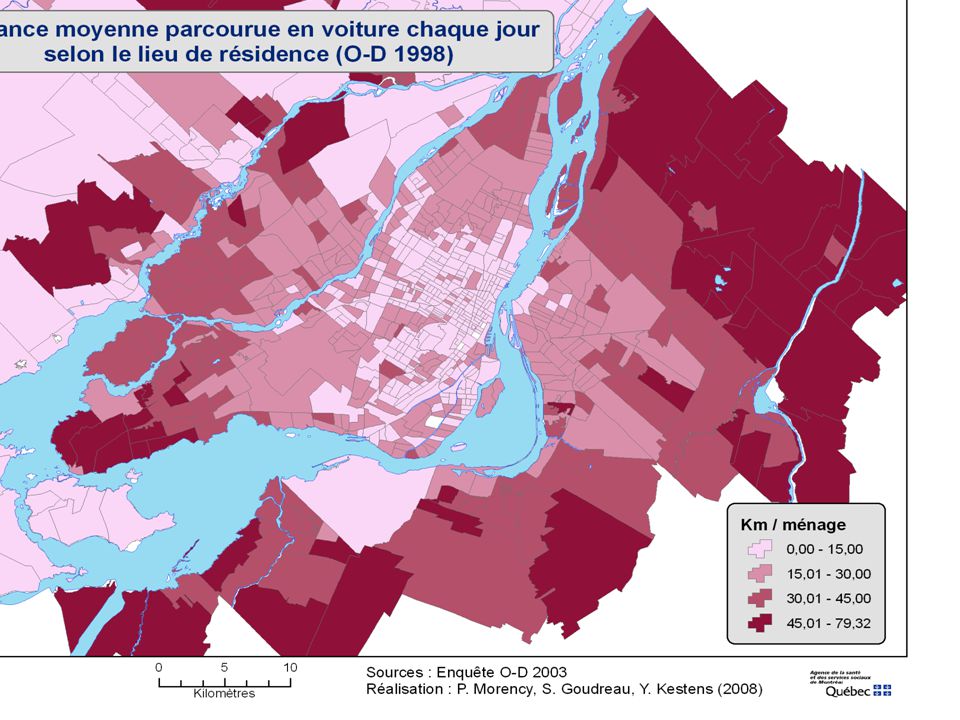
Food access in neighborhood : proximity and types of stores, diversity and quality of foods available, cost… « Food Deserts » ! ! ! ? ? ? Environmental issues – use of car for food shopping, proximity of services, proximity of production sites Food system includes all phases that lead to food consumption, that is from the field to the fork and to the garbage disposal In Montreal , the food sector constitues the second economic sector. In public health, there is no doubt about the impact of foods on health whether we talk about health problems or about well being. The relationships are also well recognised between health inequalites and inequalities in the food environment. Since the beginning of the nineties, an important number of researches have also raised concern about inequalities in food access and its influence on food choices quality Food access may refer to different elements in a community : for example it may mean access to different types of stores, or to the diversity and quality of food offered, or it may mean the economic access related to revenue or to the cost of food CLIC In Great Britain they used the term food deserts to torefer to urban sectors where residents do not have physical and economic access to healthy foods. We therefore asked the question, «Are there food deserts in Montreal» ? Mais il y a d’autres enjeux de santé publique qui sont reliés au système alimentaire urbain et ce sont les enjeux d’ordre environnemental. Selon diverses estimations (entre autres à Toronto), l’utilisation de l’automobile pour les achats alimentaitres compte à elle seule pour 20 % des déplacements en voiture dans la ville. Cela exclut le transport commercial des aliments. Sur le même thème Martin Caraher, a rapporté que 95 % des clients des supermarchés s’y rendent en auto. Nous n’échappons pas à ce comportement encore plus important en Amérique. Des études de marché récentes au Québec ont mis en relief que la proximité est l’un des premiers critères des consommateurs dans leur choix du commerce alimentaire. Mais cette notion de proximité est plus ou moins étendue selon que l’on possède une auto ou non. Le transport en commun ne s’avère pas l’idéal pour le consommateur lorsqu’il s’agit de faire son marché. Nos observations nous ont menés à mieux examiner l’alimentation à Montréal, i.e. en intégrant plusieurs aspects que nous venons de mentionner
, l’utilisation de l’automobile pour les achats alimentaitres compte à elle seule pour 20 % des déplacements en voiture dans la ville. Cela exclut le transport commercial des aliments. Sur le même thème Martin Caraher, a rapporté que 95 % des clients des supermarchés s’y rendent en auto. Nous n’échappons pas à ce comportement encore plus important en Amérique. Des études de marché récentes au Québec ont mis en relief que la proximité est l’un des premiers critères des consommateurs dans leur choix du commerce alimentaire. Mais cette notion de proximité est plus ou moins étendue selon que l’on possède une auto ou non. Le transport en commun ne s’avère pas l’idéal pour le consommateur lorsqu’il s’agit de faire son marché. Nos observations nous ont menés à mieux examiner l’alimentation à Montréal, i.e. en intégrant plusieurs aspects que nous venons de mentionner.")
8
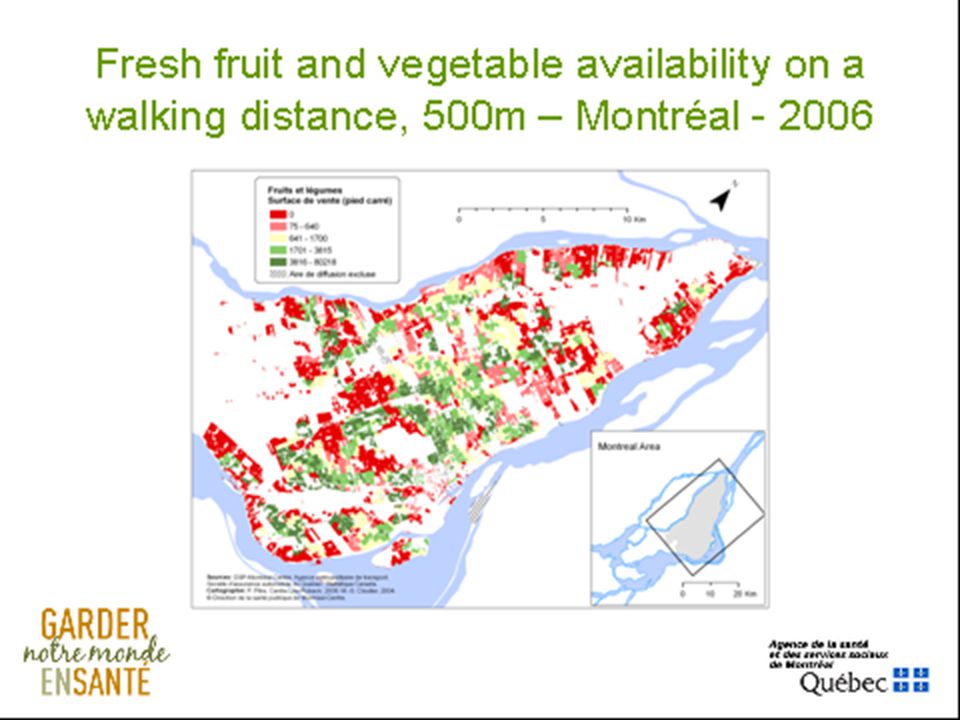
Are there inequalities in access to healthy foods in Montreal?
Source: Bertrand and coll., 2007 Title : Fruit and Vegetable Index of Accessibility, region of Montréal ( DSP 2006) We measured fruit and vegetable selling areas in all food stores (total 501) of the region, including Fruiteries, and public markets. Measures were applied to dissemination areas ( DA ) for which unit Census Tract provides population characterisitics. We first estimated the access taking into account motorization rates. The index sums total F/V selling area on a 3km buffer zone for motorized pop and on a 500m buffer zone for non motorized pop in each DA. Even with a high motorization rate ( > 90 %), people living in West Island do not have access to fresh fruits and vegetables near their home ( within 3km with a car or 500m if walking). In the most urban part we see a rather good access with the index. However, since we are working on reducing car use in the city we focused our interest on access to F/V on a walking distance. The next slide shows another reality. This slide shows
 We measured fruit and vegetable selling areas in all food stores (total 501) of the region, including Fruiteries, and public markets. Measures were applied to dissemination areas ( DA ) for which unit Census Tract provides population characterisitics. We first estimated the access taking into account motorization rates. The index sums total F/V selling area on a 3km buffer zone for motorized pop and on a 500m buffer zone for non motorized pop in each DA. Even with a high motorization rate ( > 90 %), people living in West Island do not have access to fresh fruits and vegetables near their home ( within 3km with a car or 500m if walking). In the most urban part we see a rather good access with the index. However, since we are working on reducing car use in the city we focused our interest on access to F/V on a walking distance. The next slide shows another reality. This slide shows.")
10
CSSS St-Léonard et Saint-Michel (Source: Bertrand and coll., 2007)
Fruit and vegetable selling areas within a walking distance of 500 m ( DSP 2006) En pieds carrés Grey zones indicate DAs with 0 F/V availability. Red zones indicate a weak availability. Dark green zones are the best deserved DAs . Dotted zones indicate poor sectors. In this particular CSSS territory we observed that poor sectors are disseminated in all categories of F/V availability which means that in some sectors, poor families still can have a good access to F/V on a walking distance but in other neighborhoods no. So everywhere in Montréal we have to be cautious about these disparities within even a local community.
 En pieds carrés. Grey zones indicate DAs with 0 F/V availability. Red zones indicate a weak availability. Dark green zones are the best deserved DAs . Dotted zones indicate poor sectors. In this particular CSSS territory we observed that poor sectors are disseminated in all categories of F/V availability which means that in some sectors, poor families still can have a good access to F/V on a walking distance but in other neighborhoods no. So everywhere in Montréal we have to be cautious about these disparities within even a local community.")
11
Actions sur la sécurité alimentaire et l’approche de développement durable à l’échelle des quartiers
Vitalité économique Diversifier les commerces de proximité; Revitaliser le secteur économique des quartiers; Soutenir les producteurs locaux; Faciliter l’achat d’aliments à coût raisonnable Qualité de vie Réduire la circulation motorisée; Promouvoir la préservation de la qualité des sols; Promouvoir l’utilisation responsable de l’eau; Aménager des espaces verts, des jardins collectis; Promouvoir l’achat d’aliments transportés sur de courtes distances; Promouvoir la consommation d’aliments non transformés; Implanter des stratégies de réduction des emballages. Économie Environnement D U R A B L E Équité Favoriser l’accès pour tous à des aliments santé de coût raisonnable; Assurer l’accès aux ressources conférant des connaissances et des habiletés (jardins collectifs, cuisines collectives…); Développer la solidarité sociale. Influencer les politiques Social Ceci fait le lien avec la définition que nous avons vue de l’OMS Milieu de vie Aménager des pistes cyclables, des voies piétonnières; Aménager des espaces verts, des jardins collectifs; Embellir des rues commerciales. Convivialité Aménager des espaces publics, des marchés publics; Mettre en place des mécanismes de participation citoyenne; Organiser des événements de promotion des aliments du quartier. Septembre Direction de santé publique – Agence de la santé et des services sociaux de Montréal
; Développer la solidarité sociale. Influencer les politiques. Social. Ceci fait le lien avec la définition que nous avons vue de l’OMS. Milieu de vie. Aménager des pistes cyclables, des voies piétonnières; Aménager des espaces verts, des jardins collectifs; Embellir des rues commerciales. Convivialité. Aménager des espaces publics, des marchés publics; Mettre en place des mécanismes de participation citoyenne; Organiser des événements de promotion des aliments du quartier. Septembre Direction de santé publique – Agence de la santé et des services sociaux de Montréal.")
12
Our actions Community mobilisation 17 local projects financed by Montréal Public Health involving multiple partners (NGOs, local health and social services centers, local municipalities, food producers…) aimed at making healthy food accessible within 500 m of walking distance from the home Research: access to healthy foods; food consumption; practices and concerns among poor families Support Nourrir Montréal, a regional assembly Working with arrondissements
 aimed at making healthy food accessible within 500 m of walking distance from the home. Research: access to healthy foods; food consumption; practices and concerns among poor families. Support Nourrir Montréal, a regional assembly. Working with arrondissements.")
13
Jardin Guybourg, Mercier-Ouest
Pour pouvoir accueillir un producteur, les données de la DSP ont été utilisées; nous-mêmes avons recouru à nos informations pour appuyer la table locale de concertation par une lettre à l’arrondissement.. J’ajouterai que les intervenants locaux n’ont pas manqué non plus d’utiliser les informations pour interpeller les candidats des dernières élections municipales. ET parmi ces derniers quelques-uns s’en sont servi pour leurs propres promesses…. Toronto Public Health a soumis à la consultation une proppsition «Toward a healthy and sustainable food system for Toronto Jardin Guybourg, Mercier-Ouest

14
Urban transportation: a question of health

15
Trends in trips: a 20-year evolution on the territory of AMT (1987 boundaries, am peak)
2008 Δ By car 39% By public transit 8% Population 19% (0.8% p.a.) Nb of cars 49% (1.9% p.a.) Source : Enquête O-D 2008, Faits saillants
 Nb of cars % (1.9% p.a.) Source : Enquête O-D 2008, Faits saillants.")
16
Health impacts Diseases related to air pollution
Injuries and death caused by road accidents Diseases related to physical inactivity Problems associated to high volume of car traffic, speed of vehicles, inadequacies of of public transit ,lack of active transportation amenities All these impacts essentially related to traffic volume (VKT)
")
18
The presence of air pollutants varies according to traffic volume
Source: Smargiassi and coll., 2005

19
RR adjusted for SES (IC95%)
Hospitalization for respiratory problems in people aged 60 years and older Traffic category Number of cases (%) Number of controls (%) RR (IC95%) RR adjusted for SES (IC95%) <3160 vehicles 5 322 (91,7%) 36 725 (93,5%) 1.00 vehicles 345 (5,9%) 1 922 (4,9%) 1.24 ( ) p<0.001 1.07 ( ) p=0.28 >7700 vehicles 138 (2,4%) 613 (1,6%) 1.55 ( ) 1.30 ( ) p=0.007 Source: Smargiassi and coll., 2006
 Number of controls (%) RR. (IC95%) RR adjusted for SES (IC95%) <3160 vehicles (91,7%) (93,5%) vehicles (5,9%) (4,9%) ( ) p< ( ) p=0.28. >7700 vehicles (2,4%) 613. (1,6%) ( ) ( ) p= Source: Smargiassi and coll.,")
20
The number of road injuries varies directly with traffic volume
Source : P Morency, MS Cloutier, Urgences-santé ; C. Morency. Enquête O-D 1998.

21
Pedestrians are injured at thousands of different sites!
: ambulance calls Carte pts rouge partout! Source: Morency and Cloutier, 2005

22
Strategies advocated towards sustainable transportation
Reduce the number of vehicle-kilometers travelled Increase the number of trips by public and active transportation Reduce the speed of vehicles Design walkable neighbourhoods Improve mobility for all this implies action on the transportation system (road dieting, traffic calming, efficient public transit,, high degree of connectivity, bicycle and pedestrian infrastructures…) It also implies action on land use (slowing down urban sprawl, designing more compact neighbourhoods with a mixity of uses and functions
 It also implies action on land use (slowing down urban sprawl, designing more compact neighbourhoods with a mixity of uses and functions.")
23
Recent examples of advocacy
Participation in public hearings and debates Transportation projects Notre-Dame hybrid boulevard/expressway Turcot A-25 Montréal transportation plan Road safety code Urban planning CHUM, U de M campus in Outremont Griffintown development project

24
Active transportation

25
Walking in Montréal 35% of trips shorter than 2 km are made walking
Almost all (96%) walking trips are shorter than 2 km 40% to 50% of peak hour travel are walking trips in Montréal central area. It goes down to 20% in peripheral areas Enquête Origine Destination 2003
 walking trips are shorter than 2 km. 40% to 50% of peak hour travel are walking trips in Montréal central area. It goes down to 20% in peripheral areas. Enquête Origine Destination")
26
Walking’s decrease Between1998 and 2003, proportion of 6 to 12 year old students walking to go to school went from 45% to 34% in Montréal(Enquête OD, 1998 et 2003) During the same period, car trips to school increased from 17% to 32% (Enquête OD, 1998 et 2003)
 During the same period, car trips to school increased from 17% to 32% (Enquête OD, 1998 et 2003)")
27
Biking 32,5% of the 12 to 17 year old use bike as a transportation mode at least 1h a week (Kino-Québec 2005) Use of bike decreases to 6,9% among people 18 years and over(Kino-Québec 2005) During peak hour, cycling can be more effective than a car trip for distance up to 8 km (Demers 2006) Document de l’UMQ
 During peak hour, cycling can be more effective than a car trip for distance up to 8 km (Demers 2006) Document de l’UMQ.")
28
Public health involvement to increase active transportation
Support community projects: Aménager des quartiers durable Quartier 21 Research: Walkability audit Promotion and education: Allego Kino-Quebec campaign’s and program

29
Support local communities
Aménagez des quartiers durables: Financial support for eight RUI of Montreal Information and educational background Example of Mercier Est Quartier 21 Financial support joint with city of Montreal Information and education background Tools Example of Peter McGill

30
Walkbility audit method
Objective grid use to characterize the urban planning and the structure of a neighbourhood (based on the evaluator’s judgement) Originally conceived for research purpose and advocacy groups Allow to collect qualitative as well as quantitative data
 Originally conceived for research purpose and advocacy groups. Allow to collect qualitative as well as quantitative data.")
31
Research Goal: Create a tool simple enough to be used by communities and complete enough to have a comprehensive picture of the field studied. Exploratory phase during summer and fall 2008 in three RUI of Montréal Second research phase upcoming this summer integrated to a Canada-wide evaluation project

32
Thank you!

Présentations similaires