Télécharger la présentation
La présentation est en train de télécharger. S'il vous plaît, attendez

1
Beyond IA Natalie Meystre, Architecte de l’information EPFL, DIT- KIS 31.10.2013

2
Architecture de l’information ART et SCIENCE de l'organisation et l'étiquetage (labeling) des sites web, intranets, communautés en ligne et logiciels, afin de les rendre faciles à utiliser (par tous) et à trouver (via les moteurs de recherche). ‘’An IA looks at a pile of unstructured content and sees maps and relationships.’’ They get excited about sorting out the mess. They bring order to things. They think about how people like to navigate, how people like to search.

3
Usability Usabilité = hygiène Making a website usable is about reducing friction. It is about making it easy to use, and making sure that the user can find what he or she needs without any considerable effort.

4
Removing friction Increasing motivation

5
Focus sur l’expérience Focus sur les tâches Subjectif, qualificatif Objectif, quantitatif Limite très difficile à surpasser

6
Designing for motivation Although making your website easy to use is critical for its success, there is more to it than just that. How do you ensure that your users experience exactly what you want them to experience? There is another important dimension to consider other than reducing friction: increasing motivation. How do you motivate your users to undertake the journey you have planned for them? How do you guide them and how do you convince them to spend more time and money on your site than at the competitor?

7
Seductive Interaction Séduction: Procédé visant à susciter délibérément une admiration, attirance, voire l'amour d'un ou de plusieurs individus, dans le but d’obtenir un avantage de la part de la personne séduite.

8
Usable & convenient Eléments esthétique dans le design Les effets graphiques facilitant la compréhension (typographie, reliefs, ombres, couleur.

9
Pleasurable Eléments attractifs Design référencé: qui rappelle qq chose Design fiable, auquel on fait confiance (pouvoir de la première impression, formée en 1/20 ème de seconde) Ce qui est plaisant fonctionne mieux (une impression plaisante détend le cerveau, un cerveau détendu accompli mieux une tâche)
 Ce qui est plaisant fonctionne mieux (une impression plaisante détend le cerveau, un cerveau détendu accompli mieux une tâche)")
10
Meaningful DEVENIR MÉMORABLE Associations d’idée Storytelling Pouvoir des visages en ligne

11
Grille d’analyse GRAPHISME (couleur, typo, composition) ICÔNES (boutons, symboles) CONTENU (textes, images, schémas, vidéos) TEXTURES / DECO (images de fond, effets) COMPRÉHENSIONASSOCIATION AFFECT
 ICÔNES (boutons, symboles) CONTENU (textes, images, schémas, vidéos) TEXTURES / DECO (images de fond, effets) COMPRÉHENSIONASSOCIATION AFFECT")
12
Boîte à outils Apporter du plaisir à utiliser le site Humour Effet surprise Effet récompense Prédictibilité Stimulation, challenge Susciter la curiosité Laisser les personnes s’exprimer Progression pas à pas (petites tâches à exécuter) Ne pas proposer trop d’options en même temps (paresse) Moins de texte Pas de surcharge sur une page (less is more) Attirer l’attention (contraste) Faciliter le chemin le plus évident Influence du vocabulaire PUMP effect (personnel, inattendu, significatif, bien présenté)
 Ne pas proposer trop d’options en même temps (paresse) Moins de texte Pas de surcharge sur une page (less is more) Attirer l’attention (contraste) Faciliter le chemin le plus évident Influence du vocabulaire PUMP effect (personnel, inattendu, significatif, bien présenté)")
13
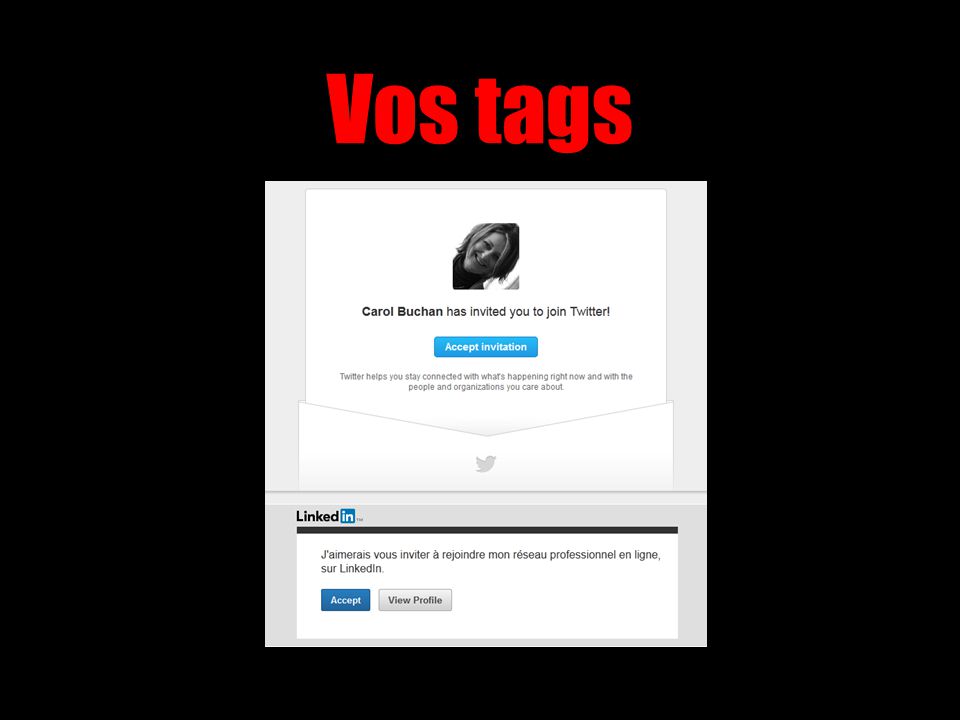
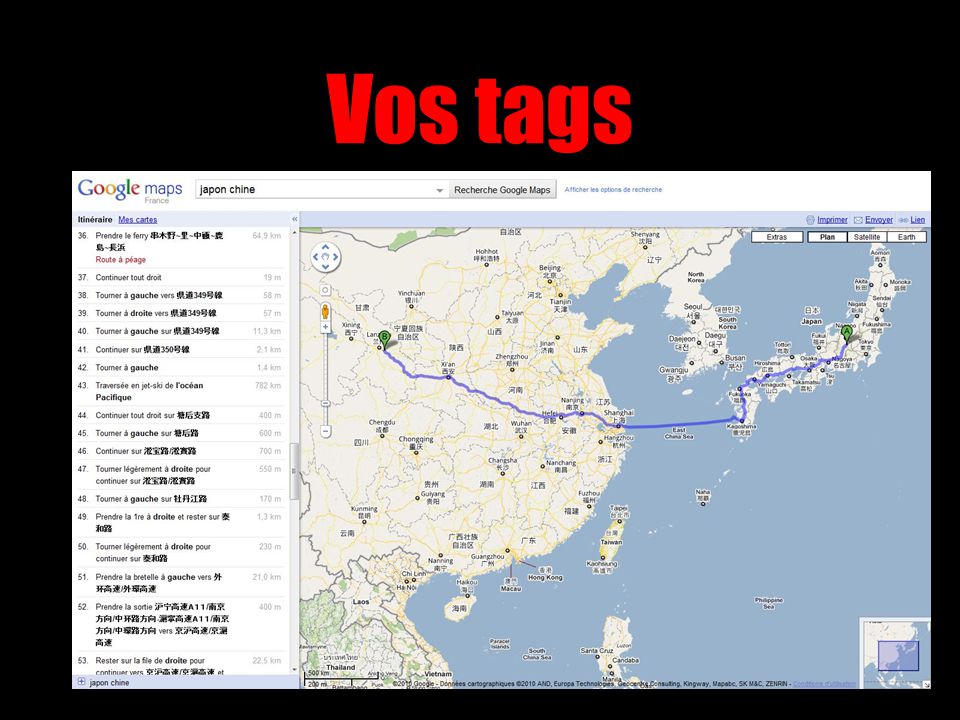
Vos tags

16
User journey Describe at a high level of detail exactly what steps different users take to complete a specific task within a system, application or website. This technique shows the current user workflow, and reveals areas of improvement for the to-be workflow. Is focused on the user and what they see and what they click on.

17
User journey A user journey is a path a user may take to reach their goal when using a particular website. User journeys are used in designing websites to identify the different ways to enable the user to achieve their goal as quickly and easily as possible. User journeys are the step by step journey that a user takes to reach their goal. This journey will often consist of a number of website pages and decision points that carry the user from one step to another. This journey is then redesigned to form an 'ideal' user journey free from frustration. The output is traditionally a flow diagram demonstrating each page and decision point throughout the entire process.

18
User journey In order to create realistic user journeys, it is important to first identify the users through an exercise called user profiling. Each user will have a task or goal they are trying to reach on the website. Users have a need they must fulfil, and the steps they take to satisfy that need is referred to as a user journey. Each user goal can be first mapped out using the current website to identify any flaws or frustrations. This is often referred to as user journey mapping or customer journey mapping. Once an understanding of existing user journeys is fully illustrated, website designers can set out their recommended user journey - one which is as simple and easy as possible for users to reach their goals.

19
User journey step Contexte – Où est l’utilisateur? Qu’est ce qui l’entoure ? Est-il distrait, souvent interrompu? Progression – Comment chaque étape du processus entraîne la suivante ? Devices – Quels sont les appareils utilisés ? Le client est-il expert ou béotion ? Quelles sont les caractéristiques des outils ? Fonctionnalités – Quels types de fonctionnalité l’utilisateur désire-t-il ? Sont- elles implémentables ? Emotion – Quelles sont les émotions ressenties à chaque étape ? Ennui, gêne, stress, satisfaction ?

20
Customer Journey Map The customer journey map is an oriented graph that describes the journey of a user by representing the different touchpoints that characterize his interaction with the service. In this kind of visualization, the interaction is described step by step as in the classical blueprint, but there is a stronger emphasis on some aspects as the flux of information and the physical devices involved. At the same time there is a higher level of synthesis than in the blueprint: the representation is simplified trough the loss of the redundant information and of the deepest details.

21
Diagramme des flux UTILISATEUR (ses actions, ses buts) TOUCHPOINT (pages web, apps…) SYSTÈME (ce qu’il produit) ÉMETTEUR (organisation) AVANT PENDANT APRÈS
 TOUCHPOINT (pages web, apps…) SYSTÈME (ce qu’il produit) ÉMETTEUR (organisation) AVANT PENDANT APRÈS")
22
EXEMPLE

23
Analyse de satisfaction

24
Service Design Changement de paradigme Le service est au centre de la réflexion Le client a à faire avec un service global, via une expérience continue. Supprimer les silos.

25
Galaxie Utilisateur Site web Centrale téléphonique Applications Publicités en ligne Guichet, réception Publicités, affiches, flyers Réseau sociaux Magasin, bureau, lieu

Présentations similaires

 DAYS OF THE.>")


 Association franco-ontarienne.>")


: You will make an oral presentation to your class on a specific.>")


