Télécharger la présentation
La présentation est en train de télécharger. S'il vous plaît, attendez

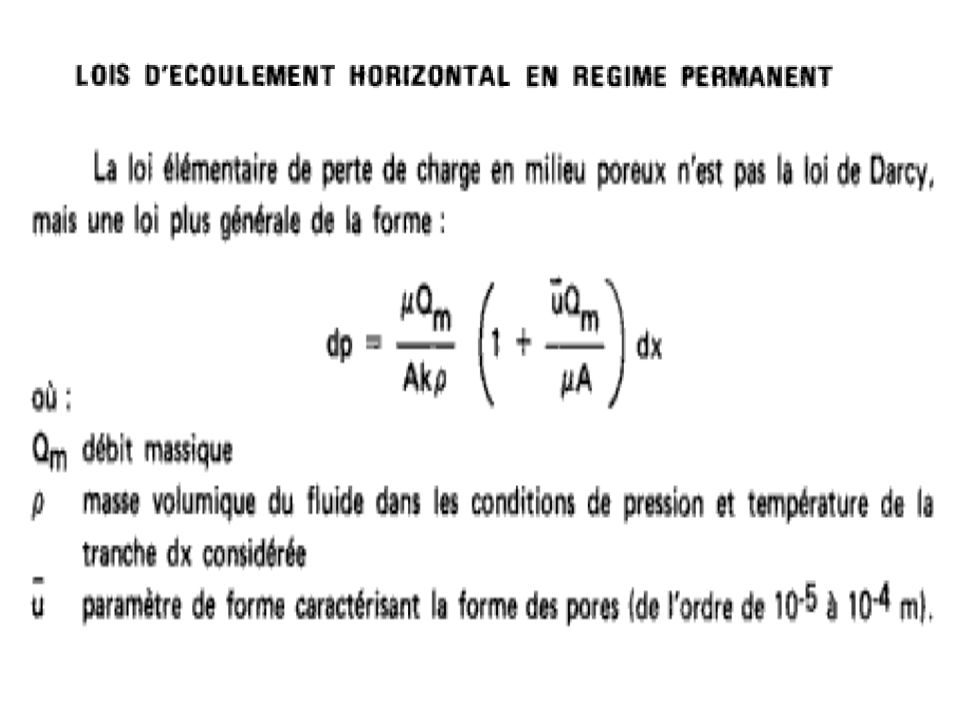
1
Introduction au Reservoir Engineering

2
Origine des Hydrocarbures
Organique Inorganique Inorganic: Chemical Reactions among water, carbon dioxide and various inorganic substances such as carbides and carbonates in the earth. Organic: Assumes that petroleum evolved from decomposition of vegetation and animal organisms that lived during previous geologic ages. The process begins with photosynthesis of plant cells. Upon burial of the plants and organisms a small fraction are not completely decomposed and will leave behind some carbon to accumulate into a reservoir or oil/gas. This slide follows with the discussion given for the basic concept. Mainly a review. Of the two theories listed, Organic is by far the most commonly accepted of the bunch. Very little time should be spent on the others. The accumulation of hydrocarbons is not always going to occur if there is organic material present. There are five things necessary for it to occur. Briefly mention these and expand on them in the next few slides.

3
Accumulation des Hydrocarbures
Cinq facteurs nécessaires: 1. Roche mère 2. Migration 3. Roche réservoir 4. Piège 5. Roche couverture Go over the slide, each item will be explained in the coming slides.

4
Source de la roche Accumulation de la matière organique
Préservation de matière organique Maturité thermique Température de surface “Fenêtre à huile" Argile ~ 65% Marne ~ 12% Carbonate ~ 21% Charbon ~ 2% SOURCE ROCKS - are any in which sufficient organic matter to form petroleum has been accumulated, preserved, and thermally matured. Organic matter will most generally settle out in quiet-water environments. Therefore, most source rocks are usually fine-grained rocks, particularly shales. Other potential source rock are lime muds (carbonates and mud-carbonate (Marl). One of the most important factors in determining whether organic rich rock will become a source rock is its thermal maturity. Some source rocks have yet to reach this level (e.g.. oil shale). Typically for oil to occur in the oil window the temperature should be between approx °F to 325°F. Above this temperature the oil will basically leak off and only leave gas behind. Below there will be a heavy tar left (typical of the Tar Sands of Canada). Much of the US contains what is left from over maturation of oil with the vast gas fields that are present. The slide also give a representation about the most common types of source rocks.
. One of the most important factors in determining whether organic rich rock will become a source rock is its thermal maturity. Some source rocks have yet to reach this level (e.g.. oil shale). Typically for oil to occur in the oil window the temperature should be between approx °F to 325°F. Above this temperature the oil will basically leak off and only leave gas behind. Below there will be a heavy tar left (typical of the Tar Sands of Canada). Much of the US contains what is left from over maturation of oil with the vast gas fields that are present. The slide also give a representation about the most common types of source rocks.")
5
Fenêtre à huile The temperature at which the source rock has been “ cooked “ is important to the viability of the reservoir. It is closely related to the depth at which the rock was buried. As all this happened a long time in the past the geologist has to track the history of the source rock. Si la température est trop basse, La matière organique ne peut pas se transformer en hydrocarbure. Si la température est trop haute, le matière organique et les hydrocarbures seront détruits

6
Migration des hydrocarbures
La migration des hydrocarbures se fait en 2 étapes: Migration primaire – de la roche mère vers la roche réservoir. C'est un processus complexe et pas entièrement compris à ce jour. Il est probablement limité à une centaine de mètres Migration secondaire – déplacement des HC le long de la réservoir jusqu’au piège. Ceci se traduit par la flottabilité des HC, la pression capillaire et par le système hydrodynamique Il peut s’étaler sur de grandes distances At present, this is most poorly understood and least measurable stage in the cycle of generation, migration and accumulation. Primary migration involves the actual expulsion of petroleum from the source rock. Secondary migration is mainly governed by buoyancy along fractures and faults to the reservoir. Secondary migration is simple to understand with the higher hydrocarbon floating to rest on top of the original water. The primary part of the process is much more complex. The exact mechanism is uncertain as the experiment cannot be done in the laboratory ( high temperature and pressure and a very long time ).
.")
7
Le piège Pièges structuraux: Piéges stratigraphiques: Pièges combinés
C’est une forme de structure géométrique, suceptible d’avoir une couche ayant de bonnes caractéristiques pétrophysiques, recouverte par une formation imperméable. Pièges structuraux: Anticlinal Anticlinal faillé Diapir de sel (Domes) Piéges stratigraphiques: Discordance Récifs Autres Pièges combinés A trap is a geometric configuration of structures and/or strata, in which permeable rock types (reservoir) are surrounded and confined by some sort of impermeable strata (seal). (See next slide for drawing of the various types of traps)
 Piéges stratigraphiques: Discordance. Récifs. Autres. Pièges combinés. A trap is a geometric configuration of structures and/or strata, in which permeable rock types (reservoir) are surrounded and confined by some sort of impermeable strata (seal). (See next slide for drawing of the various types of traps)")
8
Piège structural Anticlinal L’huile et le gaz sinstalent au sommet de la structure, recouverte par une roche imperméable Roche imperméable 7

9
Piége dôme de sel 9

10
Piége en contre-faille
10

11
Piège sous la discordance
11

12
Piège lié aux changements des propriétés du réservoir
12

13
Pièges stratigraphiques
Types de pièges Pièges stratigraphiques Piéges structuraux Pièges combinés

14
La couverture Barrière d’imperméabilité Caprocks Types de couvertures
Argiles ~ 65% Evaporites (Sel) ~ 33% Carbonates ~ 2% Shale is the most dominate caprock of worldwide reserves. Evaporites (salt) are the most efficient although.
 ~ 33% Carbonates ~ 2% Shale is the most dominate caprock of worldwide reserves. Evaporites (salt) are the most efficient although.")
15
Structure du réservoir
Beaucoup d’autre structures. Les critères d’une bonne structure il faut que: Une bonne fermeture structurale. Une grande structure pour qu’elle soit économiquement rentable. The rocks compromising the reservoir undergo significant changes due to tectonic movements. The most important is folding and faulting as it is these alterations to the initial horizontal strata which create the structures forming reservoir traps. The depositional environment contributes greatly to the variety of trap. Shallow lagoons can have reefs as well as layers of carbonates.

16
Carte du réservoir La carte au toit d’un réservoir est généralement établi à partir du niveau de la mer comme référence Les cartes peuvent également représenter les valeurs pétrophysiques et pétrographiques du réservoir. Most reservoir maps in the world use m.s.l. as the reference. Depths of the layer increases away from the crest of the structure. The reference is needed because the drilling rig can be on top of a mountain or an offshore platform. In each case the measured depth of the same layer is different as the drilling reference is different.

17
Le réservoir Deux propriétés fondamentales de base pour un réservoir qui sont: Porosité: Espace vide entre les grains Perméabilité: Pouvoir de la formation de laisser passer un fluide à travers les pores La plupart des roches réservoirs sont constitués de: Grès ~ 60% Carbonates ~ 39% Any good reservoir must have good porosity to hold the hydrocarbon and also some permeability to transmit the oil just do not exist.

18
Porosity Représentée par (Φ) très rarement par (m)
Comprise entre 5 to 30% Porosité primaire: formée au cours de la sédimentation Porosité secondaire: Formée après le processus de sédimentation Porosity is simply a measurement of pore or void space in a rock and is usually expressed as a percentage. The majority of the reservoirs fall between 10 and 20% for porosity. Porosity can be measured in the lab from cores or down hole by logging techniques using sonic, density, and neutron logs. Pores remplis par la vase, argile ayant un effet de ciment Arrangement rombohedrique Φ=26%

19
Trois types principaux de la porosité
1. Inter-connecté Passage multiple entre les pores 2. connecté Un simple passage entre les pores 3. Isolé Pas de connection entre les pores = Porosité effective Le rapport entre la porosité totale et effective est très important pour la perméabilité Inter-connected Porosity utilizes multiple pore throat passages to connect neighboring pores. Connected Porosity - has only one pore throat passage connecting with another. Isolated - has no connection between pores.

20
Example Porosité inter connecté Porosité isolé Porosité connecté
Explain the difference between the Interconnected, Connected and Isolated Porosities. Porosité connecté

21
Porosité primaire Porosité inter granulaire (Limestone's)
Primary Porosity can be divided into two types Intergranular/Intragranular. Intergranular is more typical in Sandstone and newly deposited lime/sands. With Intergranular porosity, the pore throats are generally connected, one to another by pore throat passages. Intra granular Porosity is more typical of newly-deposited skeletal lime sands. If is unusual for these pores to be preserved, they are usually in field during burial by cementation. Porosité inter granulaire (Limestone's) Porosité inter granulaire (Sandstone's)
 Porosité inter granulaire (Sandstone s)")
22
Porosité secondaire Fenestral (Shrinkage) Intercrystalline (entre
Secondary Porosity is formed within a reservoir after deposition. Fenestral (Shrinkage) Intercrystalline (entre les cristaux) Dissolution Fracture
 Intercrystalline (entre. les cristaux) Dissolution. Fracture.")
23
Mesure de la porosité E-Logs ----------> Donne la porosité totale
Sonic Logs Neutron Logs Density Logs Core Tests > Donne la porosité effective Water Saturation Gas Saturation Mercury Injection Æ Values are obtained from both E-Logs and Core Tests. Types of Core Testing include: Water Saturation: Measure the weight of a known volume of rock that has been thoroughly desiccated, then saturating the sample with deionized H2O under vacuum, then reweighing the saturated sample. Gas Saturation: Use gas as the saturating fluid. Æ is then obtained using the Boil-Mariotte Law (Pi Vi = Constant). Mercury Injection: Injecting mercury into a known volume of rock under gradually increasing pressure until stable values for ø are achieved. Most rigorous technique. All core saturation test only gives effective Æ. = ( W sat - dry )/ H 2 O V tot Æ = ( P 2 - 1 ) V Æ
. Mercury Injection: Injecting mercury into a known volume of rock under gradually increasing pressure until stable values for ø are achieved. Most rigorous technique. All core saturation test only gives effective Æ. = ( W. sat. - dry. )/ H. 2. O. V. tot. Æ. = ( P ) V. Æ.")
24
La perméabilité C’est le paramètre clé pour le réservoiriste et le producteur. La perméabilité caractérise l’aptitude qu’à une roche à laisser s’écouler des fluides à travers ses pores. La perméabilité (K) est le coefficient de proportionnalité qui relie le débit (Q) d’un fluide de viscosité (μ) qui passe à travers un échantillon de roche de section (S) et de longueur (dl), à la chute de pression (dp) nécessaire à son passage
 est le coefficient de proportionnalité qui relie le débit (Q) d’un fluide de viscosité (μ) qui passe à travers un échantillon de roche de section (S) et de longueur (dl), à la chute de pression (dp) nécessaire à son passage.")
25
Perméabilité L’unité de la perméabilité est le Darcy.
Il doit y avoir une certaine continuité entre les pores pour avoir la perméabilité. L’unité de la perméabilité est le Darcy. Le darcy est la perméabilité d’un milieu qui laisse passer 1 cm3 par seconde d’un fluide dont la viscosité est de 1 centipoise (viscosité de l’eau à 20°C) sous l’effet d’un gradient de pression d’une atmosphère par centimètre à travers une surface de 1cm2 Permeability is dependent upon the arrangement of grains and the type of cementation process that has occurred. Permeability is the basics of how fluid flows to the well bore and one of the most important factors for any type of commercial production of hydrocarbons to occur. (See GL 105 for Ref.)
 sous l’effet d’un gradient de pression d’une atmosphère par centimètre à travers une surface de 1cm2. Permeability is dependent upon the arrangement of grains and the type of cementation process that has occurred. Permeability is the basics of how fluid flows to the well bore and one of the most important factors for any type of commercial production of hydrocarbons to occur. (See GL 105 for Ref.)")
36
Effet de la taille des grains sur la perméabilité
Fig 1- 6

37
Angle de contact sur la mouillabilité
17

38
Saturation Quantité d’eau par unité de volume = f Sw
Quantité d’hydrocarbure par unité de volume = f (1 - Sw)
")
39
Relation entre la saturation et la taille des grains

40
Perméabilité et la saturation d’un fluide
Relations entre un fluide et la permébilité Perméabilité Absolue : Perméabilité de roche mesurée en présence d’un seul fluide dans les pores. Perméabilité Efficace : Perméabilité mesurée avec un fluide en présence d’un autre fluide dans les pores. Perméabilité Relative : Perméabilité Efficace/Perméabilité Absolue Quelle perméabilité nous employons dans la loi de Darcy ? • Absolute or Specific K (Transport Coefficient) - Only 1 fluid is present in the interstices. - Only 1 fluid flows and occupies the porous medium. • Effective K - When 2 or more fluids are flowed through a rock, the measured (effective) perm is less than any individual absolute permeability values. • Relative K - the ratio of effective K of each fluid to an absolute K value. Use effective K in Darcy's Law!!!
 - Only 1 fluid is present in the interstices. - Only 1 fluid flows and occupies the porous medium. • Effective K - When 2 or more fluids are flowed through a rock, the measured (effective) perm is less than any individual absolute permeability values. • Relative K - the ratio of effective K of each fluid to an absolute K value. Use effective K in Darcy s Law!!!")
41
Zone de transition : entre l’huile et l’eau

42
Comportement de phase d'un Simple-Composant

43
Diagramme en 3-D du Comportement de phase d'un Simple-Composant

44
Diagramme de phase pour deux composants purs
The important points of the Phase Diagram that should be made are: 1.Bubble Point: The point on a Phase Diagram at which the first bubbles of gas are released from a fluid due to the change in pressure or temperature or a combination of both. 2.Dew Point: This is the point at which the gas will form a liquid (usually a condensate or light low S.G.. oil. Typically the temperature is the most dominate player in this happening but as seen in the diagram pressure can have an affect. 3.Critical Point: This is the point at which the bubble pt. line and the dew pt. line meet. It is the temperature and pressure at which all properties of the liquid and the gas become identical. 4.Gases: Systems which exist in the gaseous state in the reservoir are subdivided as follows: 1. Retrograde or Condensate Gas, 2. Wet gas, 3. Dry Gas. 5.Retrograde Gas: On the following phase diagram, the fluid at Point A is above the critical temperature and is therefore a gas. On reduction of pressure from A to A1 to A Separator and stock tank, the dew point line is crossed at A1 and liquid begins to condense from the gas. If the pressure and temperature are reduced further to that of the separator, the diagram shows that as much as 25% of the fluid is now liquid. But as this fluid travels to the stock tank, only a small percentage will remain. conditions at point B to the stock tank, there is no liquid recovery and the fluid remains completely as a gas. 6.Dry Gas : If the pressure & temperature are reduced from the originals conditions at point B to the stock tank, there is no liquid recovery & the fluid remains completely as a gas.

45
Volumes in Surface vs. Downhole
Fig 1-33

46
Reservoir Drive Mechanisms
Three principle Drive Mechanisms: Solution Gas Drive (Depletion Drive) Gas Cap Expansion Drive Water Drive Now it is time to discuss the primary drive mechanism that occur during production. It should be noted that some type of expansion or replacement must take place in the reservoir before any fluids can flow to the wellbore. Possible sources of replacement for produced fluids are: Expansion of undersaturated oil above the bubble pt. Expansion of rock and of connote water. Expansion of gas released from solution in oil below the bubble pt. Invasion of the original oil bearing reservoir by the expansion of the gas from a free gas cap. Invasion of original oil bearing reservoir by the expansion of the water from an adjacent or underlying aquifer. These expansion mechanisms are not usually considered separately, and the three principle categories are as follows: Below the bubble pt. the expansion of the fluids are negligible and the drive is achieved by the release of gas coming out of solution. When gas saturation gets high enough, free gas will begin to flow and the GOR may become excessive.
 Gas Cap Expansion Drive. Water Drive. Now it is time to discuss the primary drive mechanism that occur during production. It should be noted that some type of expansion or replacement must take place in the reservoir before any fluids can flow to the wellbore. Possible sources of replacement for produced fluids are: Expansion of undersaturated oil above the bubble pt. Expansion of rock and of connote water. Expansion of gas released from solution in oil below the bubble pt. Invasion of the original oil bearing reservoir by the expansion of the gas from a free gas cap. Invasion of original oil bearing reservoir by the expansion of the water from an adjacent or underlying aquifer. These expansion mechanisms are not usually considered separately, and the three principle categories are as follows: Below the bubble pt. the expansion of the fluids are negligible and the drive is achieved by the release of gas coming out of solution. When gas saturation gets high enough, free gas will begin to flow and the GOR may become excessive.")
47
Solution Gas Drive Solution Gas Drive (Depletion Drive):
Oil is produced by the expansion of the reservoir fluids and the gas dissolved on the liquid phase. Pr > Pb

48
Solution Gas Drive 2 An initial high oil production is followed by a rapid decline. The Gas/Oil ratio has a peak corresponding to the higher permeability to gas. The reservoir pressure exhibits a fast decline. The slide shows the rapid decline in all the parameters in the reservoir, pressure, production. The GOR also declines as the gas is produced.

49
Gas Cap Drive Below the bubble pt. the expansion of the fluids are negligible and the drive is achieved by the release of gas coming out of solution.

50
Gas Invasion Gas is more mobile than oil and takes the path of least resistance along the centre of the larger channels. As a result, oil is left behind in the smaller, less permeable, channels. The very high mobility of gas (low viscosity) means that it goes down the large pore channels bypassing the smaller ones. Once past a zone the gas will continue leaving the oil trapped; it will not be produced.
 means that it goes down the large pore channels bypassing the smaller ones. Once past a zone the gas will continue leaving the oil trapped; it will not be produced.")
51
Gas Cap Drive 2 As oil production declines, gas production increases.
Rapid pressure drop at the start of production. As the gas cap expands the pressure drops hence the drive efficiency goes down. In addition there is always breakthrough of the free gas and production at an apparent high GOR. The reservoir pressure will go down quickly.

52
Water Drive The oil being produced is replaced by water, keeping the pressure constant if the replacement ratio is close to 1:1

53
Water Invasion 2 The remaining thread of oil becomes smaller.
It finally breaks into smaller pieces. As a result, some drops of oil are left behind in the channel. There will always be some oil left in the rock, 100% recovery is impossible.This residual oil fraction, Sor, is important as it controls the amount of recoverable oil.

54
Water Drive 2 This type of drive usually keeps the reservoir pressure fairly constant. After the initial “dry” oil production, water may be produced. The amount of produced water increases as the volume of oil in the reservoir decreases. Dissolved gas in the oil is released to form produced gas. The production of water will invariably increase. The amount of water finally produced depends on capabilities of the surface production facilities and the economics of the process. It can be as much as 98%. Gas production is simply that associated with the oil and depends on the gas-oil ratio.

55
Drives General A water drive can recover up to 60% of the oil in place. A gas cap drive can recover only 40% with a greater reduction in pressure. A solution gas drive has a low recovery. The slide compares the total cumulative production of the various drive mechanisms against the reservoir pressure. The water drive keeps the pressure high and hence is the most efficient at production the reservoir fluids.

56
Combined Drive Reservoir
Actual reservoirs usually present more than one drive mechanism acting at the same time

57
Drive Problems Water Drive:
Water can cone upwards and be produced through the lower perforations. Gas Cap Drive: Gas can cone downwards and be produced through the upper perforations. Pressure is rapidly lost as the gas expands. Gas Solution Drive: Gas production can occur in the reservoir, skin damage. Very short-lived. Coning is caused by producing the reservoir at a drawdown that is too high and also having perforations that are too long. The water (or gas) is drawn to the perforated interval and produced. This problem can usually be fixed.
 is drawn to the perforated interval and produced. This problem can usually be fixed.")
58
Secondary Recovery 1 Secondary recovery covers a range of techniques used to augment the natural drive of a reservoir or boost production at a later stage in the life of a reservoir. A field often needs enhanced oil recovery (EOR) techniques to maximise its production. Common recovery methods are: Water injection. Gas injection. In difficult reservoirs, such as those containing heavy oil, more advanced recovery methods are used: Steam flood. Polymer injection. . CO2 injection. In-situ combustion. Most modern reservoirs have some sort of secondary recovery built into their management from their initial production. The aim of all these schemes is to maintain the pressure in the reservoir as high as possible for as long as possible. The main problem with heavy oil is its high viscosity. Reduction of the viscosity is achieved by heating the fluid, hence the steam injection and the in-situ combustion or by adding CO2. This substance reduces the viscosity of the oil by two orders of magnitude, for example from 500 centipoise to 5. Polymer injection adds polymers to the injection water to increase the viscosity of this fluid. Ordinary water has a much lower viscosity and hence does not sweep the heavy oil efficiently.
 techniques to maximise its production. Common recovery methods are: Water injection. Gas injection. In difficult reservoirs, such as those containing heavy oil, more advanced recovery methods are used: Steam flood. Polymer injection. . CO2 injection. In-situ combustion. Most modern reservoirs have some sort of secondary recovery built into their management from their initial production. The aim of all these schemes is to maintain the pressure in the reservoir as high as possible for as long as possible. The main problem with heavy oil is its high viscosity. Reduction of the viscosity is achieved by heating the fluid, hence the steam injection and the in-situ combustion or by adding CO2. This substance reduces the viscosity of the oil by two orders of magnitude, for example from 500 centipoise to 5. Polymer injection adds polymers to the injection water to increase the viscosity of this fluid. Ordinary water has a much lower viscosity and hence does not sweep the heavy oil efficiently.")
59
Secondary Recovery 2 water injection gas injection
Water can come from the sea water, or a nearby and different aquifer. The injectors are set in patterns depending on the permeability of the reservoir. Gas often comes from produced can which can be compressed and re-injected into the gas cap. Both types of injection can operate at the same time.

60
Darcy’s Law = 7.08 x 1 -3 k h ( P r - wf ) m o b (ln e w - 0.75 + S) q
-3 k h ( P r - wf ) m o b (ln e w S) q o qo = Oil flow rate, stb/d k = Permeability, md h = Reservoir thickness, ft Pe = Reservoir pressure, psi Pwf = Bottom hole flowing pressure, psi µo = Oil viscosity, cp ßo = Formation volume factor, res bbls/stb re = Reservoir drainage radius, ft rw = Wellbore radius, ft S = Skin factor Darcy's Law explains how fluid flows through a porous media and is directly proportional to the DP and permeability.
 m. o. b. (ln. e. w S) q. o. qo = Oil flow rate, stb/d. k = Permeability, md. h = Reservoir thickness, ft. Pe = Reservoir pressure, psi. Pwf = Bottom hole flowing pressure, psi. µo = Oil viscosity, cp. ßo = Formation volume factor, res bbls/stb. re = Reservoir drainage radius, ft. rw = Wellbore radius, ft. S = Skin factor. Darcy s Law explains how fluid flows through a porous media and is directly proportional to the DP and permeability.")
61
Darcy’s Law In The Oilfield
Radial Reservoir Flow: The rate at which fluid flows at the sandface is a function of the reservoir thickness, the exterior reservoir radius, the pressure drawdown in the reservoir, the reservoir permeability, the fluid viscosity, and the skin in the wellbore area. Darcy's Law is perhaps the single most important relationship in petroleum reservoir engineering. It relates rate with the pressure drawdown and is often used to decide on an appropriate stimulation treatment. Darcy's Equation for radial flow assumes: 1. Infinite acting radial flow 2. K is effective permeability 3. Homogeneous Reservoir 4. Q is measured at perfs. (Horizontal Flow) 5. Isothermal Conditions 6. No turbulence (Laminar Flow) 7. Non Reactive Fluid Because Darcy's Law is fundamental in reservoir engineering the students must understand all variables and constants of the equation. Now that we can see how the fluid, be it oil or gas, is transmitted to the wellbore we need to incorporate the idea of radial flow. Discuss how the flow flows in a radial pattern towards the wellbore. Stress the fact that, as it nears the wellbore, many things take place, (i.e. large amount of the total pressure drop in the system, as much as 50% or more. The temperature of the fluid may drop and a drastic increase in fluid velocity, due to the change in area/volume that the fluid will be flowing.) Relate all this to the idea of the Critical Matrix Area.
 5. Isothermal Conditions 6. No turbulence (Laminar Flow) 7. Non Reactive Fluid. Because Darcy s Law is fundamental in reservoir engineering the students must understand all variables and constants of the equation. Now that we can see how the fluid, be it oil or gas, is transmitted to the wellbore we need to incorporate the idea of radial flow. Discuss how the flow flows in a radial pattern towards the wellbore. Stress the fact that, as it nears the wellbore, many things take place, (i.e. large amount of the total pressure drop in the system, as much as 50% or more. The temperature of the fluid may drop and a drastic increase in fluid velocity, due to the change in area/volume that the fluid will be flowing.) Relate all this to the idea of the Critical Matrix Area.")
62
Variables in Darcy’s Law
k, Permeability, (md) The ability of a formation to transmit fluids through the pore spaces: - The greater the permeability, the greater the degree to which pores are connected. - Consequently, the greater the ability of the well do produce. - Obtained from a DST, pressure build-up test, or pressure drawdown test. It is very important that the students have a good understanding of what permeability is at this point. You should also give some examples of different areas and the type of perm. encountered in these areas (i.e., Gulf Coast, North Sea, Alaska, Saudi, etc...) Go over the terminology of each of these clearing up any questions along the way. Note ßo - this may give some problems. Stress that the flow at the sand face (wellbore) is not the same as that at the surface and this is why the FVF is in Darcy's Law to compensate for this.
 The ability of a formation to transmit fluids through the pore spaces: - The greater the permeability, the greater the degree to which pores are connected. - Consequently, the greater the ability of the well do produce. - Obtained from a DST, pressure build-up test, or pressure drawdown test. It is very important that the students have a good understanding of what permeability is at this point. You should also give some examples of different areas and the type of perm. encountered in these areas (i.e., Gulf Coast, North Sea, Alaska, Saudi, etc...) Go over the terminology of each of these clearing up any questions along the way. Note ßo - this may give some problems. Stress that the flow at the sand face (wellbore) is not the same as that at the surface and this is why the FVF is in Darcy s Law to compensate for this.")
63
Variables in Darcy’s Law (2)
h, Reservoir Thickness, (ft) The net productive reservoir thickness: - Usually obtained from log evaluations (gamma ray log) Pressure drawdown, (Pr - Pwf), psi * Pr - The average reservoir pressure * Pwf - The pressure at the wellbore when the well is flowing • Reservoir Thickness, h, (ft): The net pay thickness is the average thickness of the formation in the drainage area through which the fluid flows into the well. It is not just the perforated interval or the formation thickness encountered by the well. Usually obtained from E-Logs. Field practice is to use perforated height. Pressure Drawdown, (Pr - Pwf), psi 1. Average reservoir pressure, Pr, is the stabilized reservoir pressure if all the wells in the reservoir are shut in. The best method of obtaining an estimate of this pressure is by conducting a build up test. 2. Wellbore or well flowing pressure, Pwf, is the pressure at the wellbore.
 The net productive reservoir thickness: - Usually obtained from log evaluations (gamma ray log) Pressure drawdown, (Pr - Pwf), psi. * Pr - The average reservoir pressure. * Pwf - The pressure at the wellbore when the well is flowing. • Reservoir Thickness, h, (ft): The net pay thickness is the average thickness of the formation in the drainage area through which the fluid flows into the well. It is not just the perforated interval or the formation thickness encountered by the well. Usually obtained from E-Logs. Field practice is to use perforated height. Pressure Drawdown, (Pr - Pwf), psi. 1. Average reservoir pressure, Pr, is the stabilized reservoir pressure if all the wells in the reservoir are shut in. The best method of obtaining an estimate of this pressure is by conducting a build up test. 2. Wellbore or well flowing pressure, Pwf, is the pressure at the wellbore.")
64
Variables in Darcy’s Law (3)
rw, Wellbore Radius, (ft) The radius of the wellbore at which Pwf is measured. Remember, units are in feet! bo , Formation Volume Factor, (res bbl/stb) The amount of oil in the formation that is required to give one bbl at the surface (Stock tank). Due to dissolved gas which is released with temperature and pressure changes. µo , Oil Viscosity, (cp) A measure of the fluid’s resistance to flow. Empirical correlations are used to determine viscosity at different reservoir temperatures & Pressures. • Wellbore Radius, rw, ft: The radius of the wellbore at which Pwf is measured. • Viscosity, µ, (cp): The absolute viscosity of a fluid is a measure of the fluid's resistance to flow. Empirical correlations are used to determine viscosity at different reservoir temperatures and pressures. • Formation Volume Factor, ßo, (res bbl/STB): The volume occupied by 1 STB oil plus solution gas at some elevated pressure and temperature. It is a measure of the oil as it is brought to stock - tank conditions.
 The radius of the wellbore at which Pwf is measured. Remember, units are in feet! bo , Formation Volume Factor, (res bbl/stb) The amount of oil in the formation that is required to give one bbl at the surface (Stock tank). Due to dissolved gas which is released with temperature and pressure changes. µo , Oil Viscosity, (cp) A measure of the fluid’s resistance to flow. Empirical correlations are used to determine viscosity at different reservoir temperatures & Pressures. • Wellbore Radius, rw, ft: The radius of the wellbore at which Pwf is measured. • Viscosity, µ, (cp): The absolute viscosity of a fluid is a measure of the fluid s resistance to flow. Empirical correlations are used to determine viscosity at different reservoir temperatures and pressures. • Formation Volume Factor, ßo, (res bbl/STB): The volume occupied by 1 STB oil plus solution gas at some elevated pressure and temperature. It is a measure of the oil as it is brought to stock - tank conditions.")
65
Variables in Darcy’s Law (4)
re, Reservoir Exterior Radius, (ft) The radius of drainage. What is re for 160 acre spacing? ...80 acre spacing? ...40 acre spacing? = A p r e where A= area of circular drainage in sq.. ft. Darcy's Law for a gas well is different from that of an oil well due to the properties of the gas Vs. oil (i.e., Z-Factor and the P2 terms which are explained in next 2 slides.) The radius of drainage may be difficult to determine. However, the exact valve of re is not critical since the flow rate predictions value is dampened by taking the natural log of re/rw, as seen in Darcy's Law for radial flow.
 The radius of drainage. What is re for 160 acre spacing acre spacing acre spacing = A. p. r. e. where A= area of circular drainage in sq.. ft. Darcy s Law for a gas well is different from that of an oil well due to the properties of the gas Vs. oil (i.e., Z-Factor and the P2 terms which are explained in next 2 slides.) The radius of drainage may be difficult to determine. However, the exact valve of re is not critical since the flow rate predictions value is dampened by taking the natural log of re/rw, as seen in Darcy s Law for radial flow.")
66
Skin Factor Some physical impairment which adds an additional pressure drop to the system. Pseudo Skin Formation Damage Total Skin = Pseudo Skin + Skin due to Damage Explain that skin damage is a physical impairment that will cause an additional pressure drop to the system. Pseudo Skin : the pressure drop associated through any piece of hardware of flowline. Formation Skin :an impairment causing additional pressure drop anywhere in the production system from the wellbore to perforations and into the formation.

67
Skin Examples Pseudo Skin: Formation Damage:
Producing at high rates --> turbulence Collapsed tubing, perforations Partial penetration Low Perforation Density (Shots/ft) Etc. Formation Damage: Scales Organic/Mixed Deposits Silts & Clays Emulsions Water Block Wettability Change These are some examples for both pseudo skin and formation skin. The only type that Dowell Schlumberger can remove is the formation skin. For the Pseudo skin we can only give recommendations for them.
 Etc. Formation Damage: Scales. Organic/Mixed Deposits. Silts & Clays. Emulsions. Water Block. Wettability Change. These are some examples for both pseudo skin and formation skin. The only type that Dowell Schlumberger can remove is the formation skin. For the Pseudo skin we can only give recommendations for them.")
68
Example An oil well produces 57 B/D under the following reservoir and producing conditions: k = 1 md h = 50 ft bo = 1.23 res bbl/stb mo = .6 cp Pr = 2,000 psi Pwf = 500 psi rw = .33 ft re = 1,320 ft What is the Skin Factor ? Is this a candidate well for stimulation ? S = 5 If S = 0 Q = 86 B/D This is not bad candidate for a matrix job.

69
Darcy’s Law for Gas = 703 x 1 k h ( P - ) m T Z (ln + S) q
Why do we use the square of the pressure with the gas? = 703 x 1 -6 k h ( P r 2 - wf ) m g T res Z (ln e w + S) q g Qg = Gas Flow Rate, MSCF/D k = Permeability, md. h = Productive Reservoir Thickness, ft. Pe = Reservoir Pressure, psi. Pwf = Bottom Hole Flowing Pressure, psi. µ = Gas Viscosity, cp. T = Reservoir Temperature, °R (°R = °F ) Z = Compressibility Factor, Fraction. re = Reservoir Drainage Radius, ft. rw = Wellbore Radius, ft. S = Skin Factor. The Z-Factor explains how the gas will deviate from that of a perfect gas (i.e. if you doubled the pressure on a container which held a perfect gas, then the volume should decrease by 1/2.) This is not always the case and that is why we use the Z-Factor, to help compensate for this. The determination of the Z-Factor is a fairly complicated procedure and is really up to the instructor as to whether you decide to locate the charts necessary and equations to calculate it. I feel that it may add too much of a confusion factor.
 m. g. T. res. Z (ln. e. w. + S) q. g. Qg = Gas Flow Rate, MSCF/D. k = Permeability, md. h = Productive Reservoir Thickness, ft. Pe = Reservoir Pressure, psi. Pwf = Bottom Hole Flowing Pressure, psi. µ = Gas Viscosity, cp. T = Reservoir Temperature, °R (°R = °F + 460) Z = Compressibility Factor, Fraction. re = Reservoir Drainage Radius, ft. rw = Wellbore Radius, ft. S = Skin Factor. The Z-Factor explains how the gas will deviate from that of a perfect gas (i.e. if you doubled the pressure on a container which held a perfect gas, then the volume should decrease by 1/2.) This is not always the case and that is why we use the Z-Factor, to help compensate for this. The determination of the Z-Factor is a fairly complicated procedure and is really up to the instructor as to whether you decide to locate the charts necessary and equations to calculate it. I feel that it may add too much of a confusion factor.")
70
Variables in Darcy’s Law for Gas
Z, Gas Deviation Factor, (fraction) The Z-factor tells how the gas differs from how it behaves Vs. an Ideal Gas. Obtained from the critical temperature and critical pressure as a function of the gas gravity. Why the P2 terms are used in the equation for a gas well here ? Accounts for the compressibility of gas with changes in Temperature and Pressure. Darcy's Equation was initially derived for fluids in laminar flow. Laminar flow is typical of liquid flow at low to moderate flow rates. When flow rates are high or the fluid viscosity is low, as with gas, the flow is turbulent. This slide was completed so as to help lead the students into the thought process of the phase behavior of the fluid as it is changing with pressure and temperature. It should be noted that the phase diagram will be different for each type of fluid due to the %'s of different components that make up the fluid.
 The Z-factor tells how the gas differs from how it behaves Vs. an Ideal Gas. Obtained from the critical temperature and critical pressure as a function of the gas gravity. Why the P2 terms are used in the equation for a gas well here Accounts for the compressibility of gas with changes in Temperature and Pressure. Darcy s Equation was initially derived for fluids in laminar flow. Laminar flow is typical of liquid flow at low to moderate flow rates. When flow rates are high or the fluid viscosity is low, as with gas, the flow is turbulent. This slide was completed so as to help lead the students into the thought process of the phase behavior of the fluid as it is changing with pressure and temperature. It should be noted that the phase diagram will be different for each type of fluid due to the % s of different components that make up the fluid.")
71
Well Performance For fluid to flow into the well, some difference in pressure must exist between the fluid in the reservoir and the wellbore. Drawdown = Pr - Pwf Productivity Index (J), is the ratio between production rate and total pressure drawdown. J = q / ( Pr - Pwf ) Well Performance: Each reservoir and each well will produce differently based on a number of things (i.e., K, fluid properties, drive mechanisms) which will all have an effect on the pressure drop (drawdown) from the reservoir to the wellbore. Productivity Index is only applicable to oil wells and only during psuedosteady/steady state flow conditions. Productivity Index is also written as PI.
, is the ratio between production rate and total pressure drawdown. J = q / ( Pr - Pwf ) Well Performance: Each reservoir and each well will produce differently based on a number of things (i.e., K, fluid properties, drive mechanisms) which will all have an effect on the pressure drop (drawdown) from the reservoir to the wellbore. Productivity Index is only applicable to oil wells and only during psuedosteady/steady state flow conditions. Productivity Index is also written as PI.")
72
Reservoir Flow • Wellbore Storage Effects • Transient Flow
Expansion of fluid in the wellbore • Transient Flow Early time of production • Pseudo steady State Flow Rate of pressure decline is constant throughout the reservoir • Steady State Flow Pressure at the outer boundary stays constant Reservoir Flow: During the life of a well, production will be characterized by different flow in the reservoir, i.e., pressure effects. Wellbore Storage Effects: At very early times the fluid production tends to come from the expansion of the fluid in the wellbore rather than the formation. Transient Flow: During the early (transient) times of production, the wellbore flowing pressure, Pwf, goes through a rapid pressure drop (depending upon the permeability of the reservoir). For high perm zones the transient period may only be for a couple of minutes, while it may be days or weeks for a tight formation.
 times of production, the wellbore flowing pressure, Pwf, goes through a rapid pressure drop (depending upon the permeability of the reservoir). For high perm zones the transient period may only be for a couple of minutes, while it may be days or weeks for a tight formation.")
73
IPR Curves Ideal IPR Curve Real IPR Curve BHP (Flowing) BHP (Flowing)
Vogels IPR: The Productivity Index concept relies on the assumption that reservoir fluid properties remain constant and are not a function of pressure. As shown earlier, the phase behavior of a fluid changes with pressure. For solution - gas drive reservoirs when producing under the bubble point, an empirical solution was derived to relate Pwf to Qmax for a two phase flow. The empirical solution is Vogel's Equation. Ideal IPR Curve Real IPR Curve

74
Well Testing Well testing will also allow us to determine if a well is producing up to its potential and verify if a stimulation treatment may be necessary. Well testing will allow us to determine various reservoir properties such as: K Skin Drainage Area Pressure Reservoir heterogenetics or boundaries HOW? * Disturb fluid equilibrium in reservoir * Monitor pressure with time * Compare response to mathematical solutions * Calculate K and S One major purpose of well testing is to determine the ability of a formation to produce reservoir fluids. Further, it is important to determine the reasons for a wells productivity. A properly designed, executed and analyzed well test usually can provide information about formation permeability, extent of wellbore, damage of stimulation, reservoir pressure and perhaps reservoir boundaries and heterogeneity's. The basic well test method is to create a pressure drawdown in the wellbore; this causes formation fluids to enter the wellbore. If we measure the flow rate and the pressure in the wellbore during production or the pressure during a shut-in period following production, you will usually have enough info to characterize the well.

75
Well Analysis (Nodal Analysis)
In Dowell it is important that we are able to know what causes a well to produce and to evaluate and identify stimulation opportunities that exist using well performance evaluation methods. The flow rate from a well is basically determined by three systems: • The Reservoir • The Method of Completion • The Plumbing System Which can Dowell have an affect on? Nodal Analysis: • Nodal analysis, defined as a systems approach to the optimization of oil and gas wells, is used to thoroughly evaluate a complete producing system. The objectives of Nodal Analysis are; (1) to optimize the system to produce the objective flow rate most economically, and (2) to check each component in the well system to determine whether it is restricting the flow rate unnecessarily. • Nodal analysis combines inflow parameters (reservoir parameters) such as IPR curves, with outflow parameters (completion methods, plumbing system), i.e., open hole completion, tubing size, etc... to optimize the production of a given well. • Nodal analysis utilizes IPR curves based on fluid flow in the reservoir, (such as Darcy's Equation, Vogels Equation and/or combinations of Vogel & Darcy Equations) and data from pressure transient tests. Fluid Flow Equations for flow in horizontal and vertical pipes is also used. Correlation's include Beggs & Brill, Fundamental Flow, Cullendar and Smith, Hagedorn & Brown along with others.
 to optimize the system to produce the objective flow rate most economically, and (2) to check each component in the well system to determine whether it is restricting the flow rate unnecessarily. • Nodal analysis combines inflow parameters (reservoir parameters) such as IPR curves, with outflow parameters (completion methods, plumbing system), i.e., open hole completion, tubing size, etc... to optimize the production of a given well. • Nodal analysis utilizes IPR curves based on fluid flow in the reservoir, (such as Darcy s Equation, Vogels Equation and/or combinations of Vogel & Darcy Equations) and data from pressure transient tests. Fluid Flow Equations for flow in horizontal and vertical pipes is also used. Correlation s include Beggs & Brill, Fundamental Flow, Cullendar and Smith, Hagedorn & Brown along with others.")
76
Nodal Analysis Possible pressure losses in the producing system for a flowing well. Show students where the IPR curve is used, (DP1) horizontal and vertical flow in piping (DP6 and DP7), remember velocity effects and frictional losses in the tubular and losses across completions (DP2).
 horizontal and vertical flow in piping (DP6 and DP7), remember velocity effects and frictional losses in the tubular and losses across completions (DP2).")
77
Nodal Analysis

Présentations similaires


 ÉCOLE POLYTECHNIQUE FÉDÉRALE DE LAUSANNE 1 Petri nets for.>")


. les critères Create a 3 minute film with a 1 minute introduction. The introduction must explain briefly.>")


 -W-W-W-Why is it important for a lab.>")
