Télécharger la présentation
La présentation est en train de télécharger. S'il vous plaît, attendez

1
SISMER Systèmes d’Informations Scientifiques pour la Mer F-NODC
Contribution to GODAR-WESTPAC from FRANCE Catherine Maillard, Michèle Fichaut, Loic Petit de la Villeon, Vincent Bernard SISMER, IFREMER Centre de Brest, BP 70, Brest Cedex, France International Workshop for GODAR-WESTPAC Tokyo, 5-7 March 2002 1

2
Data available at SISMER
174 Data sets from French cruises have been transmitted to GODAR: 50 CTD cruises = 2850 stations from 124 bottle cruises = 4037 stations from total 6887 stations International real time data archived at ARGO/CORIOLIS data centre in 2001 whole Pacific Ocean: profiles from GTS West Pacific (60N -30 S & W120 E 150): profiles 2
: profiles. 2.")
3
2850 CTD Stations 3

4
4037 Bottle Stations in WestPAC

5
77 431 ARGO Profiles (54591 in WestPAC)
")
6
Quality Assurance QC0 : Check of format and completeness of information QC1 : Check of location, Date, Duplicates QC2 : Check of the data points Results : Elimination or Quality Flag : GTSPP Flag Scale References ICES -GETADE Formatting Guidelines for Oceanographic Data Exchange ( ICES -MDM QA Guidelines - CTD - Marine Data Management working Group (CIEM) Reports UNESCO/COI/IODE : Manual of Quality Control Procedures for validation of Oceanographic Data - Manuals and Guides 26 UNESCO/IOC/IODE : GF3 A General Formattin System for Geo-Referenced Data - Manual and Guides 17 1 2 3 4 5 9 No QC Correct Inconsistent Doubtful Bad Changed Missing 6
 Reports. UNESCO/COI/IODE : Manual of Quality Control Procedures for validation of Oceanographic Data - Manuals and Guides 26. UNESCO/IOC/IODE : GF3 A General Formattin System for Geo-Referenced Data - Manual and Guides No QC. Correct. Inconsistent. Doubtful. Bad. Changed. Missing. 6.")
7
Sea Surface Salinity Project
Following OOPC and IOC/IODE XVI Conference (IODE-XVI-10) recommendation, an Underway Sea Surface Salinity Data Archiving Project has been initiated with the objective of : Swift assembly and distribution of data, ready availability and free access. Data sets and products are comprehensive in terms of the variables Encourage exploration of historical and paleo data sets. Encourage processing methods that eliminate or minimize the production of spurious signals. Ensure that adequate and timely data are available for the initialization and validation of climate forecast systems. Maximize the utility of the sustained observing system for various process or intensive studies. Work with GOOS/GCOS, World Weather Watch and Global Atmosphere Watch in development and implementation of the strategy. The JCOMM-1 meeting supported such a project urging that integration with other data collected at the same time be properly considered. 7
 recommendation, an Underway Sea Surface Salinity Data Archiving Project has been initiated with the objective of : Swift assembly and distribution of data, ready availability and free access. Data sets and products are comprehensive in terms of the variables. Encourage exploration of historical and paleo data sets. Encourage processing methods that eliminate or minimize the production of spurious signals. Ensure that adequate and timely data are available for the initialization and validation of climate forecast systems. Maximize the utility of the sustained observing system for various process or intensive studies. Work with GOOS/GCOS, World Weather Watch and Global Atmosphere Watch in development and implementation of the strategy. The JCOMM-1 meeting supported such a project urging that integration with other data collected at the same time be properly considered. 7.")
8
SSSAL Preliminary Workplan
Working Groups Data Collection Transfer, Archiving, Processing Products Second Meeting Announcement September 2002, 16-17 MEDS Ottawa, Canada Review of available products and Information 8

9
QC1 Control of the location and Date - Data collected in station
Automatic Checks Results - Flag Duplicate data sets Elimination Date Elimination or 5 Ship/Platform velocity Elimination or 5 Location/shoreline Elimination or 5 Bottom sounding (ETOPO5) Elimination or 3 5 = Correction/Interpolation 3 = doubtfull depth 9
 Elimination or 3. 5 = Correction/Interpolation. 3 = doubtfull depth. 9.")
10
QC1 Control of the location and Date VISUAL CHECKS - Data collected in station
10

11
QC2 - Control of the Data points
Automatic Checks Results - Flag Pressure + one more observation Elimination Out of the regional scale (min & max values) Increasing pressure Data below the bottom depth Coherence with pre-existing statistics (LEVITUS, REYNAUD, MODB, MEDATLAS) 2 No constant profiles Spikes Vertical stability 11
 Increasing pressure 4. Data below the bottom depth 4. Coherence with pre-existing statistics. (LEVITUS, REYNAUD, MODB, MEDATLAS) 2. No constant profiles 4. Spikes 3. Vertical stability")
12
QC2 - Control of the Data points Visual Checks
12

13
QC2 - Control of the Data points Regional Adjustment for Broad Range Checks
13

14
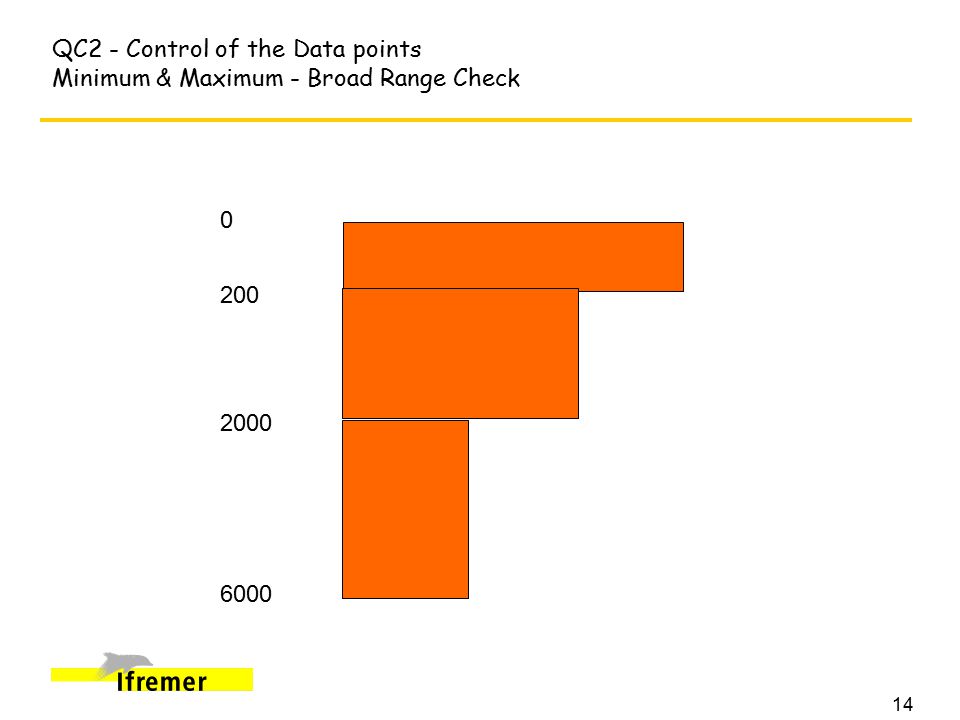
QC2 - Control of the Data points Minimum & Maximum - Broad Range Check
200 2000 6000 14
15
QC1: Control of the location and Date - Time series on fixed mooring
15

16
QC2- Stabilité Verticale
Seuil de détection de l ’instabilité : 0.03 en sigma-t pour stations profondes haute résolution à.05 à 0.1 pour stations cotières 4 points incriminés : 2 niveaux, T, S Recherche d ’ autres anomalies sur chacun de ces 4 points si oui --> flag=4 à ce point si non --> flag=4 aux 4 points et validation manuelle 16

17
Test de gradient sur 2 points en début et fin de profil
QC2 - TESTS DE PIC Test de gradient sur 2 points en début et fin de profil Test de pic sur 3 points en cours de profil seuil de gradient ajusté sur chaque zone géographique et niveau vertical 17

18
QC2- Test de la climatologie
Plusieurs climatologies disponibles : Levitus 94, 98, Reynaud, Medatlas, MODB par défaut Levitus 98 1x1 degré Définition de l ’enveloppe de variabilité Station du plateau continental fond < 100 m : 5 écarts-type Station du talus 200< fond < 500 : 4 écarts-type station profonde fond > 500 m : 3 écarts-type 18

19
Tests Visuels « Subjectifs »
Test de la cohérence interne QC1 : test de la route QC2 : coherence interne des valeurs - décalages Test de la cohérence externe QC1 : rappel des positions d ’un autre fichier si au moins une position est dans le voisinage au même moment QC2 : superposition des profils d ’un autre fichier Levers de doute stabilité verticale pics enveloppe climatologique mal définie 19

20
FORMATS Meta-Données : RDBS - ORACLE Données - Observations
autodescriptive ASCII (MEDATLAS/CORIOLIS ASCII) NetCDF incluent le meta-données sous forme de mots-clé, obligatoire ou optionnels, également copiés dans la BD ORACLE Données - données maillées MODB/MEDMEX ARGO 20
 NetCDF. incluent le meta-données sous forme de mots-clé, obligatoire ou optionnels, également copiés dans la BD ORACLE. Données - données maillées. MODB/MEDMEX. ARGO. 20.")
Présentations similaires


: Béatrice.>")


 et d'un modèle d'hydrologie.>")


