Télécharger la présentation
La présentation est en train de télécharger. S'il vous plaît, attendez

1
ENPC Cours n°12 Jean-Charles Hourcade Les termes de la négociation climat: un exemple déconomie publique appliquée

2
Untying the development/environment Gordian Knot

3
Le problème à résoudre … comment répondre à la motion Byrd – Hagel (1997) Kyoto ne contraint que 37% des émissions de GES Comment embarquer les USA dans un accord? En même temps que la Chine, lInde, le Brésil, Sans être bloqués par lOpep (pays du Golfe mais aussi Mexique, Venezuela, Indonésie) Sans marginaliser les autres pays du G77 Tout ceci très vite parce que le temps passe
 Sans marginaliser les autres pays du G77 Tout ceci très vite parce que le temps passe.")
4
Lessons from the past: Back to Stockholm After Rio two political stances: –EU: forcing the US to act + demonstration effect vis-à-vis DC –US: minimizing abatement costs A reciprocal EU/US hypnosis leading to : –treat climate policy as an isolated issue –treat the Third World as a spectator –overlook the political consequences of the cap & trade option –preserve diplomatic compromises at the cost of self- defeating rhetorics No convincing power of moral attitude if no serious consideration of the Stockholm compromise

5
Avoiding six rhetoric traps The fairness debate (thanks for the fairness but without the burden) The competitiveness argument Tension between significant world carbon prices and their distributional effects The debate between Grand accord, expanding coalitions, favella approach The Clintons mistake: a necessary domestic momentum Visions of compliance: international law, economic mechanisms and the « indulgence quarrel»
 The competitiveness argument Tension between significant world carbon prices and their distributional effects The debate between Grand accord, expanding coalitions, favella approach The Clintons mistake: a necessary domestic momentum Visions of compliance: international law, economic mechanisms and the « indulgence quarrel»")
6
Equity: burden sharing in 2030, convergence rule 1= what Parties should pay with a per capita GDP pro-rata rule (BLS like), >1 if Party pays more, <1 if Party pays less, <0 if Party gains from trading Region Normalized net costs of climate mitigation
, >1 if Party pays more, <1 if Party pays less, <0 if Party gains from trading Region Normalized net costs of climate mitigation")
7
Untying the environment-development Gordian Knot What obstacles in front of current development patterns? Which of them can be removed synergistically with the search for low carbon development pathways? Which aspects of climate policies intrinsically cannot but result in an obstacle to development? An intellectual pre-condition: from what baseline are we talking about?

8
Conventional baselines deny sustainability issues Carbon emissions BaselineClean Development Cost t Development Goals

9
Upside down: from the real baselines to detecting the deadlocks for development Carbon emissios Baseline t Sustainable Development Real Deadlocks and Constraints No Pain Venise – July 2005

10
Obstacles to sustainable development Capital Constraints and funding of infrastructures –Capital Scarcity or problem of direction of capital flows –Changing context for overseas aid and funding Decreasing amounts in ageing societies Sovereign funds LDCs still the adaptation and capacity building Macro-economic Constraints: oil prices, technology imports, public indebtedness Distorted technology choices, unfulfilled basic needs and social dualism (A.K. Sen, I. Sachs) Local environment disruption (water, air) land exacerbated in case of climate change
 Local environment disruption (water, air) land exacerbated in case of climate change.")
11
Les vrais enjeux: soit un prix du carbone croissant dans le temps pour assurer un plafonds de 450 ppm Financing structural change Price Différenciation What Compensation for OPEC and CEI ?

12
Variation de PIB en 2050 entre scénarios REF et 450 ppm / F4 taux de croissance annuel : - 0.45% pour MO et CEI F4, une croissance mondiale à peine affectée et de vrais perdants?

13
Pourquoi le F4 lève un obstacle au développement : lallègement de la facture énergétique des ménages Parts des dépenses énergétiques dans le budget des ménages

14
Un autre bénéfice du F4: baisse de la dépendance énergétique des pays hors OPEP et Russie Ratio du solde commercial énergétique sur PIB – scénario REF vs. F4

15
Pays exportateurs dénergie: fortes pertes de rentes mais question du syndrôme or des Incas Profit cumulé des exportateurs dénergie (*1000 milliards de $), par période
, par période")
16
Un paramètre central de la transition: le fardeau énergétique des ménages

17
International trading system: may export revenues imply welfare losses? $/T C (%) T (G$) EU 43 ( 56) - 0.3 - 12.2 US43 ( 43) - 0.94 - 33.6 Japan43 ( 52) - 0.62 - 4.6 China43 (189) - 1.57 - 4.2 India43 (391) - 2.16 + 22.2 Brazil43 (163) - 0.12 - 1.1
 T (G$) EU 43 ( 56) US43 ( 43) Japan43 ( 52) China43 (189) India43 (391) Brazil43 (163)")
18
USA – Europe: différences et similitudes Comparaison des dépenses énergétiques des ménages F4 vs. REF 20202050 USA +62.64%-11.88% EUR +23.18%-25.71% Comparaison des prix de production industrielle F4 vs. REF 20202050 USA +4.76%-3.68% EUR +5.57%-4.07%

19
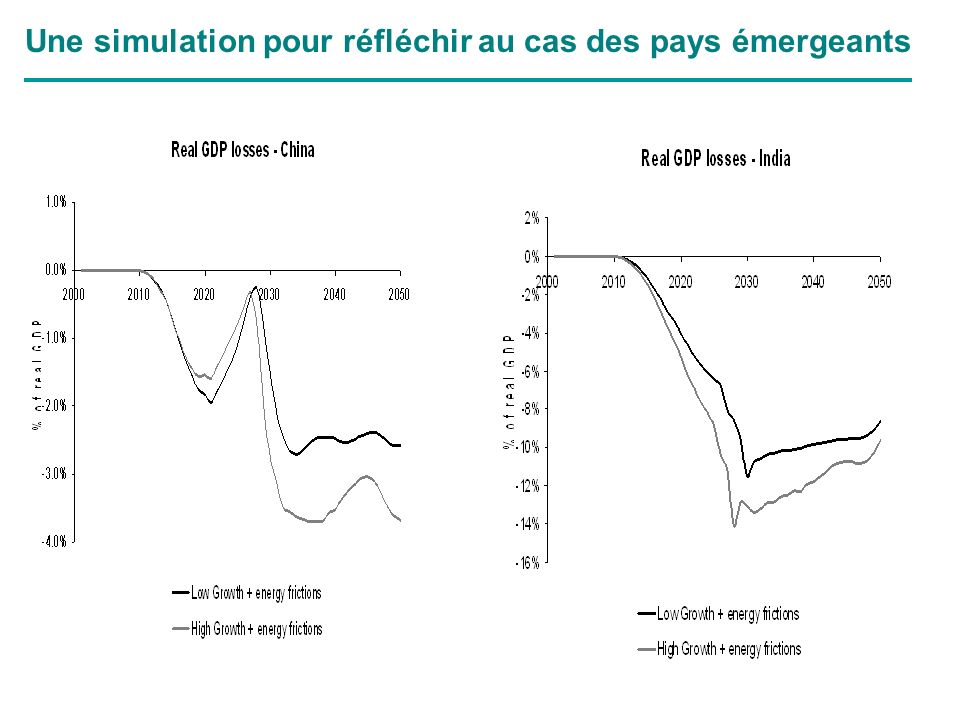
Une simulation pour réfléchir au cas des pays émergeants

21
How climate policy costs are dependant upon monetary policies

22
The beginning of the wisdom: to understand the meaning of the Kyoto surprise I did not like this proposal, (CDM), but it got a wide support and I facilitated its approval …. it can be called extraterritorial implementation …. the hypothesis that mitigation costs are lower in developing countries is true only if market distortions of values are adjusted, because otherwise everything is cheaper in developing countries including labor and natural resources. That disparity has been at the root of every colonization since the time of the Greeks. Raul A. Estrada-Oyuela

23
… a call for re-ranking priorities CDM in the KP is not a form of JI …. It is worded as a tool aiming at, in descending order: - assisting countries in achieving their Sustainable Development objectives - assisting non Annex B countries in contributing to the UNFCCC objectives - helping Annex B countries in meeting their Kyoto commitments

24
An illustration on the Electrical Sector in India Impact on land productivity, health and labor productivity of local air pollution, the electrical sector should absorb 25% of investments in the following decade State Electrical Boards in deficits Important transmission losses Power shortages several hours per day Problems of rural electrification

25
Domestic policy packages Incentives to Private investments Readjusment of selling prices Tax on non renewable energy inputs: 20% in 2035 Compensation for the redistributive effects of higher energy prices Subsidies for nuclear or renewables energy Decrease of distribution losses: from 21-23% to 6%-9% Increase of energy efficiency of thermal plants (6%) Increase of the share of Gas by 20 to 42%
 Increase of the share of Gas by 20 to 42%")
27
Assessing the economic leverage Basic mechanism: inflow of foreign capital -> reallocation of domestic capital Key parameters: –return on capital in the energy sector (-10%; 2%); –marginal productivity of capital (6%; 9%) –share of energy investment replaced by foreign inv. A 1.7 to 7 leverage

28
2nd example: carbon credits revenues to remove local barriers: the LNG Vehicles at Delhi ObstaclesBusCars Capital costs++/- Infrastructures, gas distribution ++ Individual motor vehicles: twice the Indian average, low taxation on diesel, weak public transports (rickshaws) 72% of local air pollution from transports Program voted by the Delhi Supreme Court to develop LNG
 72% of local air pollution from transports Program voted by the Delhi Supreme Court to develop LNG")
29
Extending the CDM concept … taking some risks on the accuracy Credits to the Delhi municipality: only possible actor given the diversity of operators Conventional determination of the abatement per vehicle (accuracy of measurements vs incentive efficacy) Acceptable because of the absence of rebound effects CDM revenues allocated to: –Fund a system of annual control of the vehicles –Lower the tax on diesel for down market vehicles –Or finance the distribution network
 Acceptable because of the absence of rebound effects CDM revenues allocated to: –Fund a system of annual control of the vehicles –Lower the tax on diesel for down market vehicles –Or finance the distribution network")
30
Lessons for post 2012: timing of constraints and opportunities Climate policies may be beneficial to emerging economies over the long run even with high carbon prices But carbon prices will hurt emerging economies over the short run … when they are low!!! This will not be solved in terms of « compensation » and fairness of the burden sharing The Marshall Plan metaphor revisited to reorient infrastructure investments A non intuitive but real link with monetary policies

31
Du global au sectoriel: vraies et fausses questions de compétitivité internationale

32
Faut-il vraiment mettre toutes les activités dans un même marché? Frictions entre industries différentes par: –Lintensité en carbone –Le degré dexposition internationale –La place dans la filière de production -> taux de transfert Pc -> Pv / - > valeur de la firme Quel partage de leffort entre industries et infrastructures? –Faible élasticité – prix (apparente) du secteur transport –Lhypothèse anticipations rationnelles est elle acceptable en la matière? –Dépendance au sentier et irréversibilités Comment gérer les autres gaz (incertitude sur le GWP) et la séquestration biologique (incertitude sur le bilan net)? Séminaire FONDDRI – Paris – 4 Avril 2006
 du secteur transport –Lhypothèse anticipations rationnelles est elle acceptable en la matière. –Dépendance au sentier et irréversibilités Comment gérer les autres gaz (incertitude sur le GWP) et la séquestration biologique (incertitude sur le bilan net). Séminaire FONDDRI – Paris – 4 Avril")
33
Cement Basic iron & steel Refined petroleum Pulp& Paper* Lime* Precious metals* Fertilisers & Nitrogen Other inorganic basic chemicals Household paper Malt Coke oven* Industrial gases Hollow glass Aluminium* Man-made fibres Rubber tiers Finishing of textiles Dyes and pigments Non-wovens Direct emissions Indirect emissions from electricity UK GDP Potential Maximum Gross Value Added at Stake CO 2 : 20/t CO 2 Electricity: 10/MWh 0% 10% 20% 30% 40% 0.0%0.2%0.4%0.6%0.8%1.0% Price increase: Demailly, Grubb, Hourcade, Neuhoff and Sato (2007),Cambridge/ CIRED. Convened by Climate Strategies CO2 cost screen: sectors potentially exposed under unilateral CO 2 pricing

34
Cement sector Illustrative for UK - but numbers can still change significantly Most leakage concerns from clinker – easily transportable 0% 10% 20% 30% 40% 50% 60% 70% 0500100015002000250030003500 GVA (million Euro) Electricity GVAS/ CO2 GVAS Cost increase electricity Cost increase ele+CO2 Cost increase electricity from clinker Cost increase ele+CO2 from clinker Clinker Cement Concrete products (concrete products for construction; mixed concrete etc)
 Electricity GVAS/ CO2 GVAS Cost increase electricity Cost increase ele+CO2 Cost increase electricity from clinker Cost increase ele+CO2 from clinker Clinker Cement Concrete products (concrete products for construction; mixed concrete etc)")
35
Steel sector Most exposure from BOF (and possible coke oven) Steel can be transported at semi-finished stage 0% 10% 20% 30% 40% 50% 050010001500200025003000 350 0 Gross value added (million Euro) Electricity GVAS/ CO2 GVAS Cost increase electricity Cost increase ele+CO2 Cost increase electricity from slab Cost increase ele+CO2 from slab Semi Finished Hot rolled iron& steel Illustrative for UK - but numbers can still change significantly
 Steel can be transported at semi-finished stage 0% 10% 20% 30% 40% 50% Gross value added (million Euro) Electricity GVAS/ CO2 GVAS Cost increase electricity Cost increase ele+CO2 Cost increase electricity from slab Cost increase ele+CO2 from slab Semi Finished Hot rolled iron& steel Illustrative for UK - but numbers can still change significantly")
36
Profil du prix du carbone dans les secteurs dinfrastructure Un modèle simple à deux périodes TranSust – October 28th 2004

37
Quelle structure de base pour un régime international?

38
Cap&Trade, for lack of anything better Internationally coordinated carbon tax (Nordhaus, Cooper) –Distributional effects : the BSL theorem requires differentiated C-taxes or compensations –No net transfers to developing countries Coordination of P&Ms : the essence of a nightmare R&D investment on carbon-free techniques: –Some misunderstandings about the nature of innovation –OK but where are the incentives? –OK but are you sure to put the money on technologies appropriate to our specific contexts?

39
Le système de Kyoto... et ce quil nest pas Kyoto repose sur des engagements quantitatifs des Etats qui peuvent (ou pas) importer des permis et ninstaure pas de marché mondial généralisé Les Etats signataires sont libres de gérer comme ils veulent leur contrainte globale … et de diffracter le prix du carbone comme ils lentendent Kyoto nest pas une Grande Architecture rigide; il permet : –Une incitation pour que les gouvernements mettent en jeu les mesures (prix de lénergie, politiques urbaines, transports –Une diversification des modalités dapplication vis-à-vis des secteurs industriels pour lesquels limpact sur la valeur de la firme pourrait provoquer des risques majeurs de délocalisation et de fuite de carbone Sa faiblesse: pas de système sérieux dobservance;
 importer des permis et ninstaure pas de marché mondial généralisé Les Etats signataires sont libres de gérer comme ils veulent leur contrainte globale … et de diffracter le prix du carbone comme ils lentendent Kyoto nest pas une Grande Architecture rigide; il permet : –Une incitation pour que les gouvernements mettent en jeu les mesures (prix de lénergie, politiques urbaines, transports –Une diversification des modalités dapplication vis-à-vis des secteurs industriels pour lesquels limpact sur la valeur de la firme pourrait provoquer des risques majeurs de délocalisation et de fuite de carbone Sa faiblesse: pas de système sérieux dobservance;.")
40
Amending Kyoto: a workable architecture if no crispation on the entitlement issue no global binding cap until the Portuguese per capita income level is reached (principles to be discussed) a menu of –non binding national emissions caps –sectoral binding quotas allowing to a direct access to ICT and allowing to help domestic PAMs –CDM redesigned as a support to domestic policies price-caps and price-floors –Safety valve Hedging against uncertainty –A compliance tool and a levy for development Risk mitigation instruments to secure (early) investments in carbon saving infrastructures
 a menu of –non binding national emissions caps –sectoral binding quotas allowing to a direct access to ICT and allowing to help domestic PAMs –CDM redesigned as a support to domestic policies price-caps and price-floors –Safety valve Hedging against uncertainty –A compliance tool and a levy for development Risk mitigation instruments to secure (early) investments in carbon saving infrastructures")
41
… and if no crispation on the favella vs grand archictecture debate The climate regime cant pretend to dictate all core decisions contributing to decarbonisation Carbon prices will not do the job alone They will have weak (and possibly perverse) influence on informal activities and will be swamped by high noise from other price signals (interest rates, real estates, land, shadow price of security, insurance costs) But they can operate as an attractor aligning bottom- up initiatives with pledges and review and the are a pre-condition for securing their consistency
 influence on informal activities and will be swamped by high noise from other price signals (interest rates, real estates, land, shadow price of security, insurance costs) But they can operate as an attractor aligning bottom- up initiatives with pledges and review and the are a pre-condition for securing their consistency")
42
An architecture which does not avoid confronting four sensitive issues Coal and sequestration: serious environmental integrity question + the « loophole » rethoric Biological sequestration: when, where, under what condition? The reform of ODA and the regulation of international capital flows Climate regime, WTO and the compliance system; an intra-european divide?

43
What Issue linkages and real motives to act for a compromise? Developed countries perspectives –Will the North consider climate only damages likely to affect them directly? –Will they interpret climate damages in the developing countries as source of instability –Will there be a link with other strategic issues Developing countries perspectives –Degree of concern about global warming: –Not to be isolated from an emerging regime –Opportunity to reform the international economic order

44
The last good news? Gleneagle G8: We will act with resolve and urgency to meet our shared and multiple objectives of reducing GHGs emissions, improving the global environment, enhancing energy security and cutting air pollution in conjunction with our vigorous efforts to reduce poverty We face a moment of opportunity given the demand for infrastructure investment in DCs; back to the Marshall plan metaphora? To respond the discontents of globalisation: universal solidarity triggered by well-informed perceptions of self-interest

Présentations similaires


 Analysis of instruments and actions to support eco-innovation and eco-investment.>")

 - Jean Rauscher>")


 A Global Partnership to accelerate progress.>")


