Télécharger la présentation
La présentation est en train de télécharger. S'il vous plaît, attendez

1
Nucléosynthèse dans les novae
Margarita Hernanz Institut d’Estudis Espacials de Catalunya, IEEC-CSIC, Barcelona Modèles de novae classiques: introduction; principales propriétés observationnelles scénario: combustion explosive de l´H et “thermonuclear runaway” modèles de novae; incertitudes nucléosynthèse génerale Modèles d’emission : nucleosynthèse noyaux radioactifs spectres et courbes de lumière revue des observations prespectives futures de détection avec INTEGRAL et d’autres instruments

2
Observation d’une nova
Nova Cygni 1975

3
Observations avec le Telescope Spatial Hubble (HST)
Nova Cygni 1992

4
Qu’est-ce que sait une nova?
Une explosion d’une naine blanche dans un système stellaire double

5
Naines blanches dans des systèmes binaires
Exemple: variable cataclísmique

6
Observation des novae: courbe de lumière optique
Luminosité temps

7
Observation des novae: courbe de lumière optique
Luminosité temps La luminosité augmente par des facteurs 104

8
Determination de distances
Observation des novae: courbe de lumière optique: relation luminosité maximum-taux tombée luminosité t2 L/10 t2=10 jours: nova rapide t2=250 jours: nova très lente Determination de distances Luminosité temps tombée L 20j j

9
Observation des novae: courbes de lumière
Satellite IUE (UV): Lbol(LV+LUV)=ct. FH Ser 1970 Lbol(LV+LUV+ LIR) =ct. Nova Cyg 1978
: Lbol(LV+LUV)=ct. FH Ser Lbol(LV+LUV+ LIR) =ct. Nova Cyg")
10
Observation des novae: spectres, determination d’abondances
Vitesses d’expansion ~ km/s Enrichissements en C, N, O, Ne Metallicités >> Solaires

11
Exemple: détermination d’abondances à partir d’observations dans l’IR

12
Distribution des novae dans notre galaxie
~35 novae/an dans notre galaxie (mais seulement 3-5 sont découvertes)
")
13
Qu’est-ce que sait une nova? Scénario
Transfer de matière de l’étoile compagnone vers la naine blanche (variable cataclismique ) Combustion hydrogène conditions dégénerescence à la surface de la naine blanque “avalanche termique” Combustion explosive H Décroissance noyaux radioactifs de courte vie dans l’enveloppe (transport par convection) Expansion enveloppe, augmentation L et expulsion matière
 Combustion hydrogène. conditions dégénerescence à la surface de la naine blanque. avalanche termique Combustion explosive H. Décroissance noyaux radioactifs de courte vie dans l’enveloppe (transport par convection) Expansion enveloppe, augmentation. L et expulsion matière.")
14
Modèles de nova: Combustion termonucléaire de l’Hydrogène
Echelles de temps plus relevantes accrétion ~ Macc/M ~ yr nucléaire ~ CpT/nuc ; au max. nuc: abondances solaires 1-10s; abondances >sol. <<1s dynamique ~ Hp/cs ~ (1/g)(P/)1/2 ; quand P et maximum: ~ 1s Phases évolutives plus importantes Accrétion: accrétion < nucléaire : accumulation matière P critique (T<TFermi degener.) TNR (avalanche termique): dégénérescence empêche exp. enveloppe MAIS: T T> TFermi (~108K per MNB =1M) CNO solaire: nuc ~ dyn ; CNO >sol.: nuc << dyn T & nuc avant expan.
(P/)1/2 ; quand P et maximum: ~ 1s. Phases évolutives plus importantes. Accrétion: accrétion < nucléaire : accumulation matière P critique (T<TFermi degener.) TNR (avalanche termique): dégénérescence empêche exp. enveloppe. MAIS: T T> TFermi (~108K per MNB =1M) CNO solaire: nuc ~ dyn ; CNO >sol.: nuc << dyn T & nuc avant expan.")
15
Modèles de nova: combustion termonu- cléaire de l’Hydrogène. Cycle CNO
Au début: + < (p,) Cycle CNO “opère” en equ. T ~108 K: + > (p,) Cycle CNO +-limité (goulot de bouteille) Convection: incorporation matière “fraîche” à la couche de combustion conv < +: transport noyaux +-instables aux régions externes froides où ils ne sont pas détruits Sa décroissance postérieure à la surface provoque l’expansion et l’augmentation de luminosité 13N 15O 16O 14N 12C 13C 15N 17O 17F AX (p,) (p,) (+) 14O 18Ne 18F 19F 18O 93s 158min ~ 102s 176s 862s
 Cycle CNO opère en equ. T ~108 K: + > (p,) Cycle CNO +-limité. (goulot de bouteille) Convection: incorporation matière fraîche à la couche de combustion. conv < +: transport noyaux +-instables aux régions externes froides où ils ne sont pas détruits. Sa décroissance postérieure à la surface provoque l’expansion et l’augmentation de luminosité. 13N. 15O. 16O. 14N. 12C. 13C. 15N. 17O. 17F. AX. (p,) (p,) (+) 14O. 18Ne. 18F. 19F. 18O. 93s. 158min. ~ 102s. 176s. 862s.")
16
Modèles de novae: nécessité de mélange coeur-enveloppe
Z observée >> solaire mélange CO ou ONe - enveloppe solaire accretée Explosion elle-même surabondance initiale de CNO mélange Many classical nova ejecta are enriched in CNO and Ne. Rosner and coworkers recently suggested that the enrichment might originate in the resonant interaction between large-scale shear flows in the accreted H/He envelope and gravity waves at the interface between the envelope and the underlying C/O white dwarf (WD). The shear flow amplifies the waves, which eventually form cusps and break. This wave breaking injects a spray of C/O into the superincumbent H/He. In the absence of enrichment prior to ignition, the base of the convective zone, does not reach the C/O interface. As a result, there is no additional mixing, and the runaway is slow. In contrast, the formation of a mixed layer during the accretion of H/He, prior to ignition, causes a more violent runaway. The envelope can be enriched by 25% of C/O by mass (consistent with that observed in some ejecta) for shear velocities, over the surface, with Mach numbers 0.4. Alexakis et al., 2004, ApJ
. The shear flow amplifies the waves, which eventually form cusps and break. This wave breaking injects a spray of C/O into the superincumbent H/He. In the absence of enrichment prior to ignition, the base of the convective zone, does not reach the C/O interface. As a result, there is no additional mixing, and the runaway is slow. In contrast, the formation of a mixed layer during the accretion of H/He, prior to ignition, causes a more violent runaway. The envelope can be enriched by 25% of C/O by mass (consistent with that observed in some ejecta) for shear velocities, over the surface, with Mach numbers 0.4. Alexakis et al., 2004, ApJ.")
17
Modèles de nuclesoynthèse dans les novae: historique
Parametrized one-zone models: Hillebrandt & Thielemann (1982); Wiescher et al. (1986); Weiss & Truran (1990); Nofar, Shaviv & Starrfield (1991); Boffin et al. (1993); Iliadis et al. (1999, 2002); Wanajo, Hashimoto & Nomoto (1999); Hix et al. (2002)... Hydrostatic models Coc et al. (1995), based on MacDonald’s fully convective model (1983) Hydrodynamic models (1D) Starrfield et al. (1972); Prialnik, Shara & Shaviv (1978); José & Hernanz (1998) Hydrodynamic models (2-3D)et very prelimary Glasner & Livne (1995), Glasner, Livne, & Truran (1997); Kercek, Hillebrandt, & Truran (1998, 1999), FLASH: near future?
; Wiescher et al. (1986); Weiss & Truran (1990); Nofar, Shaviv & Starrfield (1991); Boffin et al. (1993); Iliadis et al. (1999, 2002); Wanajo, Hashimoto & Nomoto (1999); Hix et al. (2002)... Hydrostatic models. Coc et al. (1995), based on MacDonald’s fully convective model (1983) Hydrodynamic models (1D) Starrfield et al. (1972); Prialnik, Shara & Shaviv (1978); José & Hernanz (1998) Hydrodynamic models (2-3D)et very prelimary. Glasner & Livne (1995), Glasner, Livne, & Truran (1997); Kercek, Hillebrandt, & Truran (1998, 1999), FLASH: near future")
18
Modèles de novae: calcul théorique
HYDRODYNAMICAL CODE Lagrangian, one-dimensional, implicit Convection included Hydrostatic accretion phase also modelled Profiles of r, T, v ... along the envelope for each time & Detailed nucleosynthesis, including radioactive nuclei

19
Modèles de noves: evolution couche combustion H
Carbone-oxygène M(NB)=1.15M, M(acc)=2x10⁻¹⁰M/a
=1.15M, M(acc)=2x10⁻¹⁰M/a.")
20
Modèles de novae: proprietés générales

21
Modèles de novae: reactions nucléaires importantes

22
Nucleosynthèse dans les novae et evolution chimique de la Galaxie
Mejec(theor.) ~ 2x10⁻⁵ M/nova R(novae) ~ 35 novae/an Age Galaxie ~ 1010 années Mejec,total(novae) ~ 7x10⁶ M = (7x10⁻⁴ M/an) 1/3000 Mgal(gaz+pous.) Novae peuvent être responsables des abondances galactiques des isotopes surproduits (par rap. Sol.) par des facteurs 3000
 ~ 2x10⁻⁵ M/nova. R(novae) ~ 35 novae/an. Age Galaxie ~ 1010 années. Mejec,total(novae) ~ 7x10⁶ M = (7x10⁻⁴ M/an) 1/3000 Mgal(gaz+pous.) Novae peuvent être responsables des abondances galactiques des isotopes surproduits (par rap. Sol.) par des facteurs ")
23
Nucleosynthèse dans les novae: surproductions vs. solaires

24
Nucleosynthèse dans les novae: surproductions vs. solaires

25
Nucleosynthèse dans les novae: surproductions vs. solaires
ONe 1.35M

26
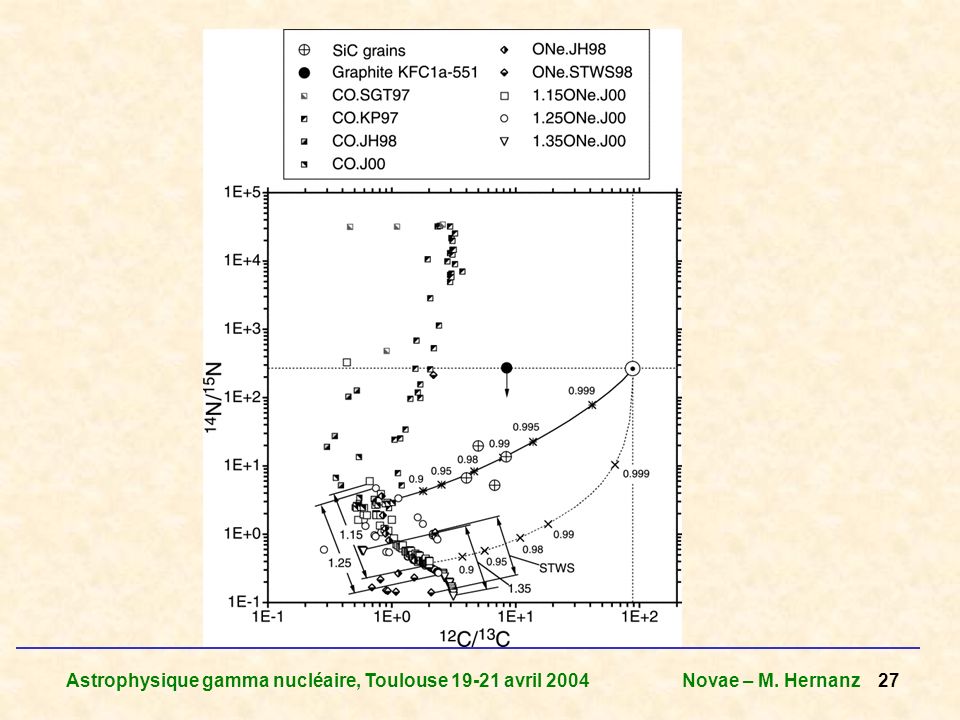
Other signatures of radioactivities in novae: presolar grains
Amari et al. 2001, ApJ five SiC and one graphite grain from the Murchison meteorite show isotopic compositions indicating a nova origin

28
Other signatures of radioactivities in novae: presolar grains

29
Other signatures of radioactivities in novae: presolar grains

30
Why novae emit gamma-rays?
Explosive H-burning: synthesis of b+-unstable nuclei 13N 14O 15O 17F 18F t 862s 102s 176s 93s 158min. crucial for enve- lope expansion crucial for g-ray emission (through e--e+ annihilation) 7Be Na Al Other radioactive nuclei synthesized t 77days yrs yrs line 478keV keV 1809keV e-capture e+-emission
 7Be 22Na 26Al. Other radioactive nuclei synthesized. t. 77days 3.75yrs 106yrs. line 478keV 1275keV 1809keV. e-capture e+-emission.")
31
Main radioactive isotopes synthesized in classical novae
Nucleus Type of emission Nova type 13N 862 s 511 keV line continuum (E<511 keV) CO and ONe 18F 158 min 7Be 77 days 478 keV line CO mainly 22Na 3.75 yr 1275 keV line ONe 26Al 1.0X10⁶ yr 1809 keV line
 CO and ONe. 18F. 158 min. 7Be. 77 days. 478 keV line. CO mainly. 22Na yr keV line. ONe. 26Al. 1.0X10⁶ yr keV line.")
32
Radioactivities in novae ejecta: some examples
* 1 h after Tpeak Rates for 18F+p reactions from Utku et al. (1998)
")
33
Modèles de novae: calcul théorique des spectres
Monte Carlo code for -ray production and transport (Ambwani & Sutherland 1988) Emission mechanisms: Positron annihilation e+ - e- two 511 keV photons (10 %) positronium formation (90 %) two 511 keV gs three <511 keV gs (25 %) (75 %) Positron-unstable nuclei included: 13N t = 862 s 18F t = 158 min 22Na t = 3.75 yrs
 Emission mechanisms: Positron annihilation. e+ - e- two 511 keV photons. (10 %) positronium formation. (90 %) two 511 keV gs. three <511 keV gs. (25 %) (75 %) Positron-unstable nuclei included: 13N t = 862 s. 18F t = 158 min. 22Na t = 3.75 yrs.")
34
Modèles de novae: calcul théorique des spectres
Emission mechanisms (cont.) Nuclear decay 7B (b-) 7Li 478 keV (t = 77 days) 22Na (b+) 22Ne 1275 keV (t = 3.75 yrs) Inverse Compton scattering Absorption mechanisms: Photo-electric absorption (E < 100 keV) e- - e+ production (E > 1022 keV) Compton scattering (100 keV<E<5 MeV)
 Nuclear decay. 7B (b-) 7Li. 478 keV. (t = 77 days) 22Na (b+) 22Ne keV. (t = 3.75 yrs) Inverse Compton scattering. Absorption mechanisms: Photo-electric absorption (E < 100 keV) e- - e+ production (E > 1022 keV) Compton scattering (100 keV<E<5 MeV)")
35
Spectra of CO novae MWD = 1.15 M¤ e+ annihilation and Comptonization
continuum and 511 keV line; e+ from 13N and 18F predicted theoretically by Clayton & Hoyle 1974; Leising & Clayton 1987 photoelectric absorption cutoff at 20 keV 478 keV line from 7Be decay transparent at 48 h d=1 kpc Gómez-Gomar, Hernanz, José, Isern,1998, MNRAS

36
Spectra of CO novae MWD = 0.8 M¤ lower fluxes
d=1 kpc lower fluxes longer duration: at 48 h there is still continuum and 511 keV line emission larger opacities of the expanding shells than in 1.15 M¤ Gómez-Gomar, Hernanz, José, Isern,1998, MNRAS

37
Spectra of ONe novae MWD = 1.15 M¤ (solid) 1.25 M¤ (dotted)
d=1 kpc photoelectric absorption cutoff at 30 keV continuum and 511 keV as in CO novae 1275 keV line from 22Na decay similar behaviour for the 2 models, because of similar KE and yields Gómez-Gomar, Hernanz, José, Isern,1998, MNRAS

38
Light curves: 478 keV (7Be) line
Only in CO novae tmax: 13 days (0.8M) 5 days (1.15 M) duration: some weeks Flux (1-2)x10-6 ph/cm2/s d=1 kpc
 5 days (1.15 M) duration: some weeks. Flux (1-2)x10-6 ph/cm2/s. d=1 kpc.")
39
Observations: 478 keV line (7Be)
TGRS SMM Theory: F<2.5x10⁻⁶/dkpc2 Harris et al and 2001 predicted theoretically by Clayton 1981

40
Radioactivities in novae ejecta: some examples
* 1 h after Tpeak Rates for 18F+p reactions from Utku et al. (1998)
")
41
Light curves: 1275 keV (22Na) line
Only in ONe novae Exponential decline Rise phase d=1 kpc tmax: 20 days (1.15M), 12 days (1.25 M) duration: some months Flux 2x10⁻⁵ ph/cm2/s
, 12 days (1.25 M) duration: some months Flux 2x10⁻⁵ ph/cm2/s.")
42
Observations: 1275 keV line (22Na)
CGRO/COMPTEL: no detection; upper limits Iyudin et al. 1995, A&A predicted theoretically by Clayton & Hoyle, 1974

43
Observations : 1275 keV line (22Na)
Upper limits in agreement with current theoretical predictions Iyudin et al. 1995, A&A

44
Theoretical predictions: 22Na ejected masses by ONe novae
Max/Min 4.5 3.5 1.8 (all in M) * Coc and Smirnova 2000, Phys.Rev. C: smaller Max/Min José, Coc and Hernanz 1999, ApJ
 * Coc and Smirnova 2000, Phys.Rev. C: smaller Max/Min. José, Coc and Hernanz 1999, ApJ.")
45
Light curves: 511 keV line In CO and ONe novae
511 keV line in ONe novae remains after 2 days until 1 week because of e+ from 22Na Very early appearence, before visual maximum (i.e, before discovery) d=1 kpc
 d=1 kpc.")
46
The continuum and the 511 keV line, e--e+ annihilation, are the most intense emissions, but their duration is very short and they appear before visual discovery detection requires “a posteriori” analyses with wide FOV instruments (BATSE, TGRS, RHESSI) future hard X/soft -ray surveys like EXIST can provide unique information about the Galactic nova distribution
 future hard X/soft -ray surveys like EXIST can provide unique information about the Galactic nova distribution.")
47
Gamma-ray and visual light curves
Visual maximum later than 511 keV and continuum maxima

48
Observations of the 511 keV line
WIND/TGRS: no detection; upper limits Observation of 5 known Galactic novae in the broad TGRS FOV in the period 1995 Jan June High E-resolution Ge detector: ability to detect 511 keV line blueshifted w.r.t. background line Harris et al. 1999, ApJ

49
Line profiles: 511 keV line
CO nova MWD = 1.15 M d=1 kpc The line is blueshifted, until the envelope reaches transparency: 518 keV (1h) keV (24h) FWHM (12h)= 7 keV
 512 keV (24h) FWHM (12h)= 7 keV.")
50
Observations of the 511 keV line
WIND/TGRS: “constraining” the Galactic nova rate from a survey of the Southern Sky during From the non detection, an upper limit of the Galactic nova rate was extracted: < 123 yr-1 (CO novae; rdetect.: 0.9 kpc ) < 238 yr-1 (ONe novae; rdetect.: 0.7 kpc ) Promising for future wide FOV instruments sensitive in the soft -ray range (20-511) keV Harris et al. 2000, ApJ
 < 238 yr-1 (ONe novae; rdetect.: 0.7 kpc ) Promising for future wide FOV instruments sensitive in the soft -ray range (20-511) keV. Harris et al. 2000, ApJ.")
51
Observations: 511 keV line
CGRO/BATSE List of nearby novae (d < 3-4 kpc) since CGRO launch Refs.: IAU circulars and Shafter 1997, Ap. J. 487, 226 Other candidate novae: Cru96, Sco97, Sgr98, Oph98, Sco98, Mus98 Hernanz, Smith, Fishman, et al., 2000, Proc. 5th CGRO Symp.
 since CGRO launch. Refs.: IAU circulars and Shafter 1997, Ap. J. 487, 226. Other candidate novae: Cru96, Sco97, Sgr98, Oph98, Sco98, Mus98. Hernanz, Smith, Fishman, et al., 2000, Proc. 5th CGRO Symp.")
52
Light curves: 511 keV line and continuum
CO Nova, 1.15 M ONe Nova, 1.15 M d=1 kpc

53
Summary of BATSE observations: 3- upper limits to the fluxes (ph/cm2/s)
Nova Cyg 1992 (model: 1.25M¤ ONe nova at d=1.7 kpc) Nova Sco 1992 (model: 1.15M¤ CO nova at d=0.8 kpc) Nova Vel 1999 (model: 1.25 M¤ ONe nova at d=2 kpc) * using keV data with assumed Comptonization; ** using 511 keV data only
 Nova Sco 1992 (model: 1.15M¤ CO nova at d=0.8 kpc) Nova Vel 1999 (model: 1.25 M¤ ONe nova at d=2 kpc) * using keV data with assumed Comptonization; ** using 511 keV data only.")
54
Light curves: 511 keV line. Influence of Mejected
F when Mej F when Mej d=1 kpc e+: 13N and 18F e+: 13N, 18F and 22Na

55
Light curves: 511 keV line. Influence of vejec.
F when vej d=1 kpc F before when vej

56
Nuclear uncertainties related with 18F synthesis (511 keV & continuum emission)
Rates obtained including the latest experimental data up to the end of 1999 Coc, Hernanz, José, Thibaud, 2000, A&A

57
Nuclear uncertainties related with 18F synthesis (511 keV & continuum emission)
Recent experimental determination of the 18F(p,)15O reaction rate de Séreville, Coc, Angulo et al. 2003, Phys. Rev. C: reduction of the uncertainty and nominal rate similar Good news!
15O reaction. rate. de Séreville, Coc, Angulo et al. 2003, Phys. Rev. C: reduction of the. uncertainty and. nominal rate similar. Good news!")
58
Observations with INTEGRAL/SPI
3 detectability distances (kpc): lines and continuum * 10 h integration time starting 5 h after Tpeak Width of the lines fully taken into account
: lines and continuum. * 10 h integration time starting 5 h after Tpeak. Width of the lines fully taken into account.")
59
Observations with INTEGRAL/IBIS
1.25 ONe mixing with core new 18F+p & 17O+p nuclear reaction rates (affecting 18F synthesis and thus 511 keV line and continuum) Nucleosynthesis from this model: published in José, Hernanz et al. ApJLett., 2003; -ray spectra: unpublished Spectra binned with E=E/2 and continuum sensitivity of IBIS/ISGRI (E=E/2; tobs=10h)
 Nucleosynthesis from this model: published in José, Hernanz et al. ApJLett., 2003; -ray spectra: unpublished. Spectra binned with E=E/2 and continuum sensitivity of IBIS/ISGRI (E=E/2; tobs=10h)")
60
Observations with INTEGRAL/IBIS
Continuum detectability distances with IBIS-ISGRI (at 100 keV): tobs=time if time<10h tobs=10h if time>10h time: since explosion (Tpeak)) M: model shown in previous page A&C: other models But chance nova in FOV very small C A M
: tobs=time if time<10h. tobs=10h if time>10h. time: since explosion (Tpeak)) M: model shown in previous page. A&C: other models. But chance nova in FOV very small. C. A. M.")
61
Novae distances observed
1275 keV: d<0.5kpc 1/5 yr 511 keV & cont.: d<(3-4)kpc (6-9)/(5 yr) Distances from Shafter 1997,ApJ
kpc (6-9)/(5 yr) Distances from Shafter 1997,ApJ.")
62
Galactic distribution of -ray emission from novae
Theoretical predictions:Jean, Hernanz, Gómez-Gomar, José, 2000, MNRAS Observations (upper limits): Leising et al. 1988, Harris et al 1991, 1996
: Leising et al. 1988, Harris et al 1991,")
63
26Al ejected masses by ONe novae Nuclear uncertainties
Max/Min 3.6 4.4 7.3 (all in M) José, Coc and Hernanz 1999, ApJ Contribution of novae to Galactic 26Al: M(26Al) 2.0 M * Mej(26Al)/(10-7 M) * RN/(35 yr-1) * fONe/0.5 0.4 M < M(26Al) from CGRO/COMPTEL 1809 keV map
 José, Coc and Hernanz 1999, ApJ. Contribution of novae to Galactic 26Al: M(26Al) 2.0 M * Mej(26Al)/(10-7 M) * RN/(35 yr-1) * fONe/0.5 0.4 M < M(26Al) from CGRO/COMPTEL 1809 keV map.")
64
Summary (-ray emission)
Classical novae produce gamma-rays: CO novae: lines at 478 and 511 keV; continuum 20E 511 keV ONe novae: lines at 511 keV and 1275 keV; continuum 20E 511 keV Detectability distances with INTEGRAL/SPI typically are 0.2 kpc during weeks (478 keV line), 0.5 kpc during months (1275 keV line) and 3 kpc during hours (511 keV and continuum) Future 1275 keV emission map will provide direct and unique information about the distribution of ONe novae in the Galaxy. The continuum and the 511 keV line are the most intense emissions, but their duration is very short and they appear before visual discovery detection requires “a posteriori” analyses with wide FOV instruments (BATSE, TGRS) future gamma-ray surveys (EXIST?) can provide unique information about the Galactic nova distribution
, 0.5 kpc during months (1275 keV line) and 3 kpc during hours (511 keV and continuum) Future 1275 keV emission map will provide direct and unique information about the distribution of ONe novae in the Galaxy. The continuum and the 511 keV line are the most intense emissions, but their duration is very short and they appear before visual discovery. detection requires a posteriori analyses with wide FOV instruments (BATSE, TGRS) future gamma-ray surveys (EXIST ) can provide unique information about the Galactic nova distribution.")
Présentations similaires

![[number 1-100].](/1/172887/big_thumb.jpg "[number 1-100].>")


 Michel Tenenhaus.>")


 Nombres (1-100).>")

 Please Translate the Following: 1. I love the math course. (Adorer.>")