Télécharger la présentation
La présentation est en train de télécharger. S'il vous plaît, attendez

1
Arbre = réseau connexe non cyclique
Quelques définitions Arbre = réseau connexe non cyclique noeud branche Réseau connexe non cyclique Réseau non connexe non cyclique Réseau connexe cyclique

2
Jeong et al, Nature 2001

3
Qualité du réseau d’interactions
Très nombreuses interactions protéine/protéine détectées par différentes méthodes Pourquoi ? Les méthodes sont prévues pour détecter des interactions différentes (binaire pour le double hybride, interactions fortes pour la protéomique, etc.) Les méthodes se trompent (faux positifs, faux négatifs) Nécessité de valider les résultats
 Les méthodes se trompent (faux positifs, faux négatifs) Nécessité de valider les résultats.")
4
Qualité du réseau d’interactions
Construction d’un ensemble d’interactions validées manuellement interactions impliquant 1308 protéines de la levure Saccharomyces cerevisiae ( Coverage (couverture) : fraction des interactions de référence analysées par une méthode donnée Accuracy (précision) : fraction des interactions de référence retrouvées par une méthode donnée Von Mering et al, Nature (2002) 417:
 : fraction des interactions de référence analysées par une méthode donnée. Accuracy (précision) : fraction des interactions de référence retrouvées par une méthode donnée. Von Mering et al, Nature (2002) 417:")
5
Qualité du réseau d’interactions
Von Mering et al, Nature (2002) 417:
 417:")
6
Qualité du réseau d’interactions
Von Mering et al, Nature (2002) 417:
 417:")
7
Qualité du réseau d’interactions
Von Mering et al, Nature (2002) 417:
 417:")
8
Qualité du réseau d’interactions
Filtrage : interactions détectées trois fois pour le double-hybride, par exemple Von Mering et al, Nature (2002) 417:
 417:")
9
Von Mering et al. (2005) Nucleic Acids Research, 33:D433–D437
 Nucleic Acids Research, 33:D433–D437")
11
Distance et Distance caractéristique d’un réseau
la distance d(u,v) est la longueur du plus court chemin connectant deux noeuds, c-à-d le nombre minimal de noeuds qu’il faut traverser pour se rendre d’un noeud u à un noeud v la distance caractéristique L = meanu,v d(u,v) d’un graphe est la longueur moyenne du plus court chemin connectant deux noeuds
 est la longueur du plus court chemin connectant deux noeuds, c-à-d le nombre minimal de noeuds qu’il faut traverser pour se rendre d’un noeud u à un noeud v. la distance caractéristique L = meanu,v d(u,v) d’un graphe est la longueur moyenne du plus court chemin connectant deux noeuds.")
12
Diamètre d’un réseau 3 4 5 7 le diamètre D = maxu,v d(u,v) d’un graphe est la longueur du plus long des plus courts chemins connectant deux noeuds, c’est-à-dire le nombre maximal de noeuds qu’il faut traverser pour se rendre d’un noeud u à un noeud v lorsque les retours, détours et boucles sont interdits
 d’un graphe est la longueur du plus long des plus courts chemins connectant deux noeuds, c’est-à-dire le nombre maximal de noeuds qu’il faut traverser pour se rendre d’un noeud u à un noeud v lorsque les retours, détours et boucles sont interdits.")
13
Réseaux « Small-World »
dans un réseau Small-World, la plupart des noeuds sont voisins les uns des autres, c-à-d qu’il faut traverser un petit nombre de noeuds pour se rendre d’un noeud u à un noeud v ex : WWW ; liens sociaux entre les êtres humains formellement, on dit que son diamètre est petit (D ≤ 6) ces réseaux ont des distances caractéristiques faibles
 ces réseaux ont des distances caractéristiques faibles.")
14
Connectivité d’un réseau
la connectivité K d’un réseau est le nombre minimal de liens connectant deux noeuds u et v formellement, c’est le nombre minimal de noeuds qu’il faut supprimer pour déconnecter le réseau

15
Connectivité d’un noeud
la connectivité K d’un noeud (protéine i) est le nombre de liens émanant du noeud i Exponential Scale-free HUB Jeong et al, Nature 2000
 est le nombre de liens émanant du noeud i. Exponential. Scale-free. HUB. Jeong et al, Nature")
16
Une autre représentation du réseau
6 3 7 4 8 2 5 1 9

17
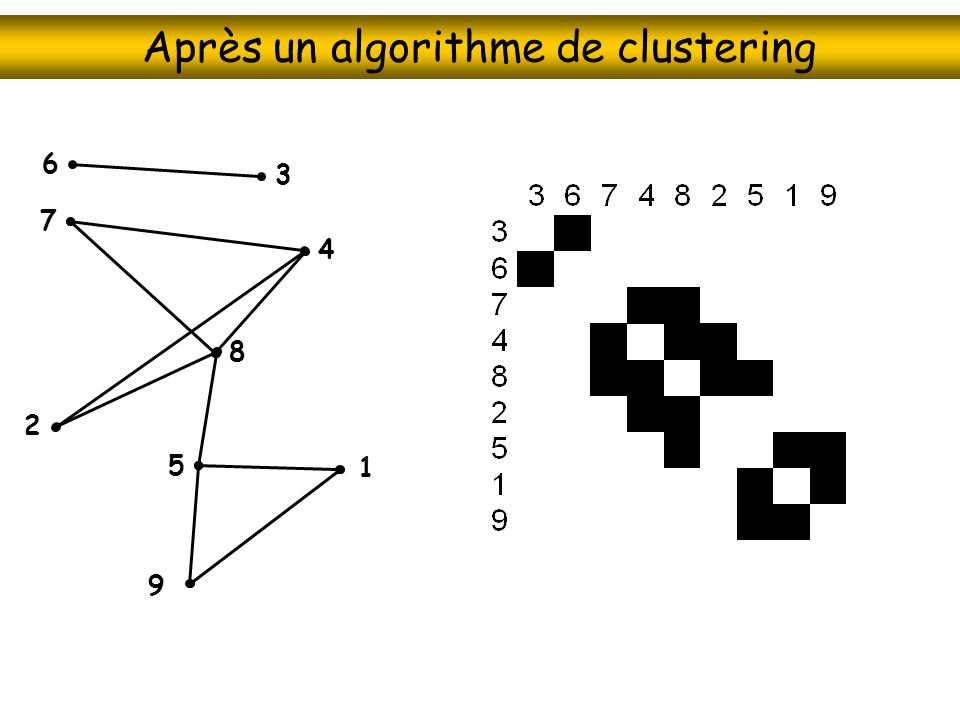
Après un algorithme de clustering
6 3 7 4 8 2 5 1 9
18
Modular organization of cellular networks
1 P - polarity R - Ras related pathway H - Highly osmotic conditions M - Mating/filamentation Rives AW et al. PNAS, 2003

19
Modular organization of cellular networks
- Modules - Intermodular connections Rives AW et al. PNAS, 2003

20
Recherche de modules Gavin et al. (2006) Nature, doi: /nature04532
 Nature, doi: /nature04532")
21
Recherche de modules A(i,j) : indice de socio-affinité
ni;j|i=bait : nombre of fois où protéines i et j sont retrouvées quand I est étiquettée : nombre of proies récupérées quand i est un appât : nombre de fois où protéines i and j sont copurifiées avec d’autres appâts. Gavin et al. (2006) Nature, doi: /nature04532
 Nature, doi: /nature")
22
Recherche de modules Gavin et al. (2006) Nature, doi: /nature04532
 Nature, doi: /nature04532")
23
Recherche de modules Gavin et al. (2006) Nature, doi: /nature04532
 Nature, doi: /nature04532")
24
Essentialité des gènes
Yu et al (2004) Trends in Genetics 20:
 Trends in Genetics 20:")
25
Essentialité des gènes
Hubs : 1061 protéines qui ont le plus grand nombre d’interactions Yu et al (2004) Trends in Genetics 20:
 Trends in Genetics 20:")
26
Robustesse du réseau aux mutations
Jeong et al, Nature 2000

27
Robustesse du réseau aux mutations
Freeland et al. (2000) Mol. Biol. Evol. 17:511–518
 Mol. Biol. Evol. 17:511–518.")
28
Perspectives : combiner les réseaux
Kelley & Iteker (2005) Nature Biotechnology 23:
 Nature Biotechnology 23:")
29
protein-protein interactions:
Large-scale experimental methods for revealing protein-protein interactions: Yeast Two Hybrid Assay AD B Reporter gene A DBD DNA Uetz P, et al. A comprehensive analysis of protein-protein interactions in Saccharomyces cerevisiae. Nature Feb 10;403(6770):623-7.( 981 interactions, 1044 proteins ) Ito T, et al. A comprehensive two-hybrid analysis to explore the yeast protein interactome. Proc Natl Acad Sci U S A Apr 10;98(8): ( 4393 interactions, 3278 proteins )
:623-7.( 981 interactions, 1044 proteins ) Ito T, et al. A comprehensive two-hybrid analysis to explore the yeast protein interactome. Proc Natl Acad Sci U S A Apr 10;98(8): ( 4393 interactions, 3278 proteins )")
30
Large-scale experimental methods for revealing
protein-protein interactions: Tandem Affinity Purification- Mass Spectrometry Gavin AC, et al. Functional organization of the yeast proteome by systematic analysis of protein complexes. Nature Jan 10; 415, ( interactions, 1361 proteins )
")
31
Large-scale experimental methods for revealing
protein-protein interactions: Tandem Affinity Purification- Mass Spectrometry Gavin AC, et al. Nature. 2006 ( ~ 500 complexes, involving ~ 60% of yeast genes )
")
32
protein-protein interactions:
Large-scale experimental methods for revealing protein-protein interactions: Yeast Two Hybrid ~6,400 interactions Pull-down ~42,000 interactions Overlap: ~400 interactions detected by all experiments ~2500 interactions detected by more than one experiment Small overlap is due to: incomplete coverage of yeast interactome by large-scale screens limitations of experimental techniques (high false positive rates, inability to capture interactions between certain classes of genes)
")
33
(Protein fragment Complementation Assays) Dynamics Pharmacology
PCA (Protein fragment Complementation Assays) Screening A A B B Screening Quantitation Pharmacology Localization Trafficking Dynamics Pharmacology PCA is not a single assay based on one reporter assay, but a general principle that allows for the design of reporters with readouts designed for specific purposes. These include simple reporters for survival-selection used to screen for protein complexes, enzymatic fluorescent reporters that provide for amplification of dynamic protein complex formation/disintegration and fluorescent proteins that allow for quantitative studies of protein complex formation and cellular trafficking. Localization Trafficking
 Screening. A. A B. B. Screening. Quantitation Pharmacology. Localization Trafficking. Dynamics Pharmacology. PCA is not a single assay based on one reporter assay, but a general principle that allows for the design of reporters with readouts designed for specific purposes. These include simple reporters for survival-selection used to screen for protein complexes, enzymatic fluorescent reporters that provide for amplification of dynamic protein complex formation/disintegration and fluorescent proteins that allow for quantitative studies of protein complex formation and cellular trafficking. Localization Trafficking.")
34
Requirements for Network Visualization
Molecular interactions are detected directly. Extremely high dynamic range Genes are expressed in a relevant cellular context, in which components of the underlying pathway exist. Events induced by any pathway perturbation can be detected, linking specific interactions to specific pathways. Subcellular locations of protein complexes can be determined unambiguously. Can be scaled and require no specialized detection technology. These are the features of PCAs that make them particularly useful for studying biochemical network dynamics using protein complex dynamics as our reporters for pathway-specific perturbations by drugs and hormones.

35
B A A Time Or P1 Assay1 P1 Assay2 Module 3 I/Io Ic/ In Module 1
Figure 1. (Left) Conceptual description of our network perturbation strategy. A symmetrical matrix, representing the hierarchal clustering of protein-protein and/or genetic interactions among genes. Light squares represent interactions between a set of genes clustered on both axes. Tight clustering around the diagonal correlate with individual functional modules (red squares) of which three (A, B and C) are represented as graphs (center). Blue nodes in the graphs represent interacting proteins to be used to probe the response of the module to perturbations using the YFP PCA. (Top right), Examples of two PCAs selected from an individual module (X1 and X2) in response to an individual perturbation (P1). Distinct responses to the perturbation are observed as either a change in intensity (X1) or cellular localization of the complex (X2). (right middle) Changes in quantity or localization of complexes are measured versus time following a perturbation (I/Io: ration of intensity I following perturbation over Io, initial intensity; Ic/In: ration of cytosolic (Ic) to nuclear (In) intensity over time following a perturbation. (bottom right) Clusters of responses of individual PCAs grouped according to modules (vertical axis, modules A, B and C) to perturbations thought to act on individual modules (horizontal axis, PA, PB and PC). Assays which report on modules A and B show unique as well as unpredicted common responses to individual perturbations by virtue of the two modules sharing one unpredicted link (see graphs, center; red link between Rim1 and Ras2) but PCA responses are not necessarily identical. For example, on the extreme right, a perturbation that acts on module A, results in an increase in signal in two PCAs that report on module A (green squares), while four assays for module B respond to the perturbation with a decrease in signal (red squares). Module C is isolated from A and B and thus PCAs for this module respond only to unique perturbations of module C. P1 P2 P3 Assays Module 1 Module 2 Module 3
 Conceptual description of our network perturbation strategy. A symmetrical matrix, representing the hierarchal clustering of protein-protein and/or genetic interactions among genes. Light squares represent interactions between a set of genes clustered on both axes. Tight clustering around the diagonal correlate with individual functional modules (red squares) of which three (A, B and C) are represented as graphs (center). Blue nodes in the graphs represent interacting proteins to be used to probe the response of the module to perturbations using the YFP PCA. (Top right), Examples of two PCAs selected from an individual module (X1 and X2) in response to an individual perturbation (P1). Distinct responses to the perturbation are observed as either a change in intensity (X1) or cellular localization of the complex (X2). (right middle) Changes in quantity or localization of complexes are measured versus time following a perturbation (I/Io: ration of intensity I following perturbation over Io, initial intensity; Ic/In: ration of cytosolic (Ic) to nuclear (In) intensity over time following a perturbation. (bottom right) Clusters of responses of individual PCAs grouped according to modules (vertical axis, modules A, B and C) to perturbations thought to act on individual modules (horizontal axis, PA, PB and PC). Assays which report on modules A and B show unique as well as unpredicted common responses to individual perturbations by virtue of the two modules sharing one unpredicted link (see graphs, center; red link between Rim1 and Ras2) but PCA responses are not necessarily identical. For example, on the extreme right, a perturbation that acts on module A, results in an increase in signal in two PCAs that report on module A (green squares), while four assays for module B respond to the perturbation with a decrease in signal (red squares). Module C is isolated from A and B and thus PCAs for this module respond only to unique perturbations of module C. P1. P2. P3. Assays. Module 1. Module 2. Module 3.")
Présentations similaires


