Télécharger la présentation
La présentation est en train de télécharger. S'il vous plaît, attendez

1
LES NOUVELLES APPROCHES DANS LE TRAITEMENT DU DIABETE DE TYPE 2
Professeur : H ELGHOMARI Service D’Endocrinologie –Diabétologie CHU Ibn Rochd . Casablanca

2
DIABETE DE TYPE 2 Les Caractéristiques
Maladie multifactoriele et polygénèque Facteurs de l’environnement (obésité, nutrition, style de vie) Facteurs Génétiques l’aspect commun de la maladie (90% des patients diabétiques) Le problème commence chez l’adolescent et maintenant chez l’enfant 80% des diabétiques sont obèses 25% des obèses deviennent des diabétiques Les complications vasculaires FREQUENTS
 Facteurs Génétiques. l’aspect commun de la maladie (90% des patients diabétiques) Le problème commence chez l’adolescent et maintenant chez l’enfant. 80% des diabétiques sont obèses. 25% des obèses deviennent des diabétiques. Les complications vasculaires. FREQUENTS.")
3
TYPE 2 DIABETES : PROBLEME DE SANTE PUBLIQUE
Percent of population 8 7 6 5 4 2025 3 2 2000 1 1995 Developedcountries Developingcountries Worldwide 1995 2000 2025 150 million of diabetic subjects worldwide in 2000 (>5% of the world population) 300 million expected in 2025 (8% of the world population) Expected increase: 40% in developed countries 170% in developing countries Source: WHO, 2001
 300 million expected in 2025 (8% of the world population) Expected increase: 40% in developed countries. 170% in developing countries. Source: WHO,")
4
Le diabète de type 2 est une maladie grave
Les complications oculaires sont une cause fréquente de cécité Les complications rénales sont la cause la plus fréquente d’insuffisance rénale terminale Le « pied diabétique » : une cause fréquente d’amputations Le diabète est un facteur majeur de risque cardiovasculaire : la moitié des diabétiques meurent d’un infarctus du myocarde ou d’un accident vasculaire cérébral

5
Within a multifactorial intervention
Control of hyperglycaemia is critical to the goal of reducing the risk of complications of diabetes Within a multifactorial intervention Hyperglycaemia High BP Lipids High BP Cardiovascular disease Microangiopathy Neuropathy eye kidney

6
Diabete crée des conditions avec un grand potentiel devastateur
MACROVASCULAR COMPLICATIONS MICROVASCULAR COMPLICATIONS Diabetic retinopathy causes 12,000 to 24,000 new cases of blindness each year, especially in adults aged 20–74 years Heart disease and stroke account for ~65% of diabetes-related deaths Diabetes is a leading cause of kidney failure; 44% of new cases during 2002 Diabetes causes > 60% of non-traumatic lower-limb amputations Diabetes and increased blood glucose levels are associated with severe and life-threatening complications.1–4 These may either be macrovascular (e.g. stroke, myocardial infarction or peripheral arterial disease) or microvascular (e.g. diabetic retinopathy, kidney function deterioration or neuropathy). Heart disease and stroke account for about 65% of deaths in people with diabetes; adults with diabetes are 2–4 times more likely to die from heart disease and 2.8 times more likely to die from stroke than unaffected adults.5 Diabetic retinopathy causes 12–24,000 new cases of blindness each year; diabetes is the leading cause of new cases of blindness in adults aged 20–74 years. In people with type 1 diabetes, maintaining blood glucose levels as close to normal as possible reduces eye damage by 76%.5 Diabetes is the leading cause of kidney failure, accounting for 44% of new cases in 2002; in people with type 1 diabetes, maintaining blood glucose levels as close to normal as possible reduces kidney damage by 35–56%.5 Approximately 60–70% of people with diabetes have some form of nervous system damage; severe forms are a major contributing factor in lower-extremity amputations. Indeed, > 60% of non-traumatic lower-limb amputations occur in people with diabetes and the rate of amputation is 10 times higher than for people without diabetes.5 Therefore, the importance of blood glucose control in preventing or reducing diabetic complications cannot be underestimated. 1. UK prospective diabetes study 16. Overview of 6 years' therapy of type II diabetes: a progressive disease. UK Prospective Diabetes Study Group. Diabetes 1995;44:1249–58. 2. Khaw KT, et al. Association of hemoglobin A1c with cardiovascular disease and mortality in adults: the European prospective investigation into cancer in Norfolk. Ann Intern Med 2004;141:413–20. 3. Stratton IM, et al. Association of glycaemia with macrovascular and microvascular complications of type 2 diabetes (UKPDS 35): prospective observational study. BMJ 2000;321:405–12. 4. Saydah SH, et al. Subclinical states of glucose intolerance and risk of death in the US. Diabetes Care 2001;24:447–53. 5. Complications of Diabetes in the United States. Available at: Last accessed 25 January 2007. ~60–70% of patients have mild to severe nervous system damage Source: American Diabetes Association, Diabetes statistics Last accessed 25 January 2007
 or microvascular (e.g. diabetic retinopathy, kidney function deterioration or neuropathy). Heart disease and stroke account for about 65% of deaths in people with diabetes; adults with diabetes are 2–4 times more likely to die from heart disease and 2.8 times more likely to die from stroke than unaffected adults.5 Diabetic retinopathy causes 12–24,000 new cases of blindness each year; diabetes is the leading cause of new cases of blindness in adults aged 20–74 years. In people with type 1 diabetes, maintaining blood glucose levels as close to normal as possible reduces eye damage by 76%.5 Diabetes is the leading cause of kidney failure, accounting for 44% of new cases in 2002; in people with type 1 diabetes, maintaining blood glucose levels as close to normal as possible reduces kidney damage by 35–56%.5 Approximately 60–70% of people with diabetes have some form of nervous system damage; severe forms are a major contributing factor in lower-extremity amputations. Indeed, > 60% of non-traumatic lower-limb amputations occur in people with diabetes and the rate of amputation is 10 times higher than for people without diabetes.5 Therefore, the importance of blood glucose control in preventing or reducing diabetic complications cannot be underestimated. 1. UK prospective diabetes study 16. Overview of 6 years therapy of type II diabetes: a progressive disease. UK Prospective Diabetes Study Group. Diabetes 1995;44:1249– Khaw KT, et al. Association of hemoglobin A1c with cardiovascular disease and mortality in adults: the European prospective investigation into cancer in Norfolk. Ann Intern Med 2004;141:413– Stratton IM, et al. Association of glycaemia with macrovascular and microvascular complications of type 2 diabetes (UKPDS 35): prospective observational study. BMJ 2000;321:405– Saydah SH, et al. Subclinical states of glucose intolerance and risk of death in the US. Diabetes Care 2001;24:447– Complications of Diabetes in the United States. Available at: Last accessed 25 January ~60–70% of patients have mild to severe nervous system damage. Source: American Diabetes Association, Diabetes statistics. Last accessed 25 January")
7
Acute Insulin Response
-cell dysfunction in Type 2 Diabetes A reduced ability of -cells to secrete insulin in response to glucose Insuline Normal Diabetes glucose Acute Insulin Response Adapted from Grodsky GM. Diabetes. 1989;38: 673.

8
POSSIBLE MECANISM OF OF CELL FAILURE IN TYPE 2 DIABETES
Insulin resistance (obesity, overfeading, physical inactivity, genetic factors?) b-cell overstimulation (b-cell stress) Compensatory increase of functional b cell mass « Robust » b cell « Susceptible » b cell Primary factors of dysfunction (genetic) N O R M G L Y C A E I H Y P E R G L C A M I Permanent sustained compensation Intolerance to glucose Early T2D Secondary factors of dysfunction (metabolic environment) b cell failure over and late T2D
 b-cell overstimulation. (b-cell stress) Compensatory increase of. functional b cell mass. « Robust » b cell. « Susceptible » b cell. Primary factors of. dysfunction (genetic) N. O. R. M. G. L. Y. C. A. E. I. H. Y. P. E. R. G. L. C. A. M. I. Permanent sustained. compensation. Intolerance to glucose. Early T2D. Secondary factors of dysfunction. (metabolic environment) b cell failure. over and late T2D.")
9
La Progression naturelle du diabète de type 2
DIAGNOSTIC 350 300 250 200 150 100 50 Glucose Post-repas Glucose À jeun Glucose (mg/dl) 250 200 150 100 50 Insulinoresistance Niveau Insuline Fonction Relative Cell (%) Insuffisance Cell Obésité IGT Diabète Hyperglycaemie Non contrôlée CHANGEMENTS MACROVASCULAIRES Manifestations Cliniques CHANGEMENTS MICROVASCULAIRES T2DM is a progressive disease characterised by declining pancreatic β-cell function leading to increasing insulin resistance and insulin deficiency. Typically, by the time of diagnosis of T2DM, 50% of β-cell function has already been lost.1 When the secretion of insulin cannot keep pace with the underlying insulin resistance, impaired glucose tolerance (IGT) and T2DM develop. Initially, the increased blood glucose is attributable to postprandial blood glucose (PPBG), but as the disease progresses, the role of fasting blood glucose (FBG) becomes important. The natural progression of T2DM is prolonged and many key features such as insulin resistance and macrovascular changes occur before hyperglycaemia develops and therefore before diagnosis. Exposure to metabolic dysregulation, even before diagnosis, substantially increases the risk of developing macrovascular complications (e.g. stroke, ischaemic heart disease and peripheral vascular disease) and microvascular complications (e.g. retinopathy, nephropathy and neuropathy) at a later date. Holman RR. Diabetes Res Clin Pract 1998;40(suppl 1):S21–5. Years Ramlo-Halsted B, et al. Prim Care 1999;26:771−89.
 Insulinoresistance. Niveau. Insuline. Fonction Relative Cell (%) Insuffisance Cell Obésité IGT Diabète. Hyperglycaemie. Non contrôlée. CHANGEMENTS MACROVASCULAIRES. Manifestations. Cliniques. CHANGEMENTS MICROVASCULAIRES. T2DM is a progressive disease characterised by declining pancreatic β-cell function leading to increasing insulin resistance and insulin deficiency. Typically, by the time of diagnosis of T2DM, 50% of β-cell function has already been lost.1. When the secretion of insulin cannot keep pace with the underlying insulin resistance, impaired glucose tolerance (IGT) and T2DM develop. Initially, the increased blood glucose is attributable to postprandial blood glucose (PPBG), but as the disease progresses, the role of fasting blood glucose (FBG) becomes important. The natural progression of T2DM is prolonged and many key features such as insulin resistance and macrovascular changes occur before hyperglycaemia develops and therefore before diagnosis. Exposure to metabolic dysregulation, even before diagnosis, substantially increases the risk of developing macrovascular complications (e.g. stroke, ischaemic heart disease and peripheral vascular disease) and microvascular complications (e.g. retinopathy, nephropathy and neuropathy) at a later date. Holman RR. Diabetes Res Clin Pract 1998;40(suppl 1):S21–5. Years Ramlo-Halsted B, et al. Prim Care 1999;26:771−89.")
10
LES ANTIDIABETIQUES UTILISES DANS LE TRAITEMENT DU DIABETE DE TYPE 2
THIAZOLIDINEDIONES SULFONYLUREAS INSULIN GLINIDES INCRETINES (GLP-1) Pancreas ? Intestin Tissu Adipeux ? METFORMIN Muscle ACARBOSE ? FOIE 7 differents approaches. No one prevents the progressive deterioration of glycemic control
 Pancreas. Intestin. Tissu. Adipeux. METFORMIN. Muscle. ACARBOSE. FOIE. 7 differents approaches. No one prevents the. progressive deterioration of glycemic control.")
11
CURRENT AGENTS USED FOR THE TREATMENT OF TYPE 2 DIABETES
Limitations et Risques Correction de l’ hyperglycémie se fait au prix Gain du poids Hypoglycémie Hyperinsulinémie Aucun effet sur l’arrêt de la progression les objectifs ne sont pas atteints souvent la maladie cardiovasculaire progresse

13
Fonction pancréatique
Le déclin de la fonction de la cellule détermine la nature de la progression du DT2 100 Moment du diagnostic ? 80 60 Fonction Cell (% de normal par HOMA) Fonction pancréatique = 50% de la normale 40 20 Six-year follow-up data from the United Kingdom Prospective Diabetes Study (UKPDS) demonstrated the decline in -cell function with T2DM over time. At the time of diagnosis, -cell function is already reduced by about 50% and continues to decline regardless of therapy. Holman RR. Diabetes Res Clin Pract 1998;40(suppl 1):S21―5. UKPDS Group. Diabetes 1995;44:1249―58. ―10 ―8 ―6 ―4 ―2 2 4 6 Temps (annéess) HOMA=homeostasis model assessment. UKPDS Group. Diabetes 1995;44:1249―58. Adapted from Holman RR. Diabetes Res Clin Pract 1998;40(suppl 1):S21―5.
 Fonction pancréatique. = 50% de la normale Six-year follow-up data from the United Kingdom Prospective Diabetes Study (UKPDS) demonstrated the decline in -cell function with T2DM over time. At the time of diagnosis, -cell function is already reduced by about 50% and continues to decline regardless of therapy. Holman RR. Diabetes Res Clin Pract 1998;40(suppl 1):S21―5. UKPDS Group. Diabetes 1995;44:1249―58. ―10. ―8. ―6. ―4. ― Temps (annéess) HOMA=homeostasis model assessment. UKPDS Group. Diabetes 1995;44:1249―58. Adapted from Holman RR. Diabetes Res Clin Pract 1998;40(suppl 1):S21―5.")
14
Incidence des complications (1,000 patient/years)
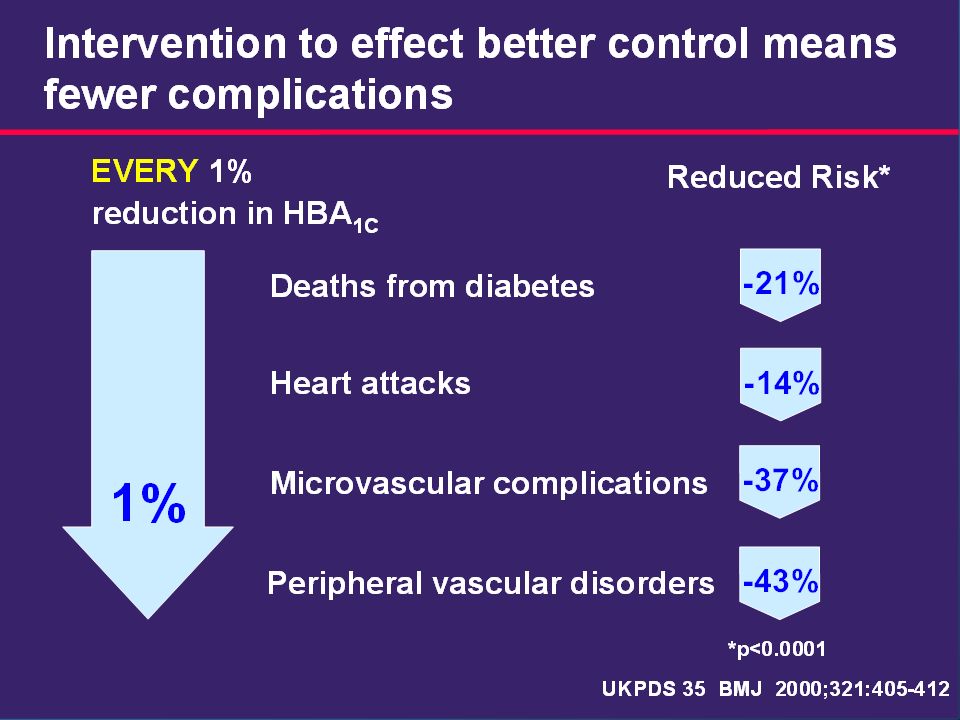
Risque de complications dans le diabète type 2 : Correlation avec HbA1c 80 Manifestations Microvasculaires Infarctus du myocarde 60 Incidence des complications (1,000 patient/years) 40 20 The UK Prospective Diabetes Study (UKPDS) showed a correlation between glycaemia and the risk of microvascular and cardiovascular complications. This highlights the importance of achieving glycaemic targets.1 Current guidelines recommend target HbA1c values of <7.0% (American Diabetes Association [ADA])2 and ≤6.5% (American Association of Clinical Endocrinologists [AACE] and IDF ).3,4 Stratton IM, et al. BMJ 2000;321:405–12. ADA. Diabetes Care 2006;29(suppl 1):S4–42. AACE. Endocr Pract 2002;8(suppl 1):40–82. IDF. Global guideline for type 2 diabetes. Brussels: International Diabetes Federation, 5 7 9 11 5 7 9 11 HbA1c (%) HbA1c (%) Stratton I, et al. BMJ 2000;321:405−12.
 The UK Prospective Diabetes Study (UKPDS) showed a correlation between glycaemia and the risk of microvascular and cardiovascular complications. This highlights the importance of achieving glycaemic targets.1. Current guidelines recommend target HbA1c values of <7.0% (American Diabetes Association [ADA])2 and ≤6.5% (American Association of Clinical Endocrinologists [AACE] and IDF ).3,4. Stratton IM, et al. BMJ 2000;321:405–12. ADA. Diabetes Care 2006;29(suppl 1):S4–42. AACE. Endocr Pract 2002;8(suppl 1):40–82. IDF. Global guideline for type 2 diabetes. Brussels: International Diabetes Federation, HbA1c (%) HbA1c (%) Stratton I, et al. BMJ 2000;321:405−12.")
15
Incidence per 1000 patient-years
15 UKPDS: elevated blood glucose levels associated with increased risk of diabetic complications 80 Microvascular disease 60 Incidence per 1000 patient-years Myocardial infarction 40 20 The incidence of myocardial infarction and clinical complications in type 2 diabetes is significantly associated with glycaemia.1 The study population included 4585 participants from the UKPDS (United Kingdom Prospective Diabetes Study), whether randomised or not to treatment. Of these, 3642 were included in an analysis of relative risk to determine the relationship between exposure to glycaemia over time and the risk of macrovascular or microvascular complications.1 The incidence rates for any endpoint related to diabetes increased with each higher category of updated mean HbA1c.1 The increase in the incidence rate for microvascular endpoints was greater over the range of increasing glycaemia than was the increase in the incidence rate for myocardial infarction. Thus, at near normal concentrations of HbA1c, the risk of myocardial infarction was 2–3 times that of a microvascular endpoint, whereas in the highest category of HbA1c concentration the risks were of the same order.1 Stratton IM, et al. BMJ 2000;321:405–412. 5 6 7 8 9 10 11 Updated mean HbA1c (%) Study population: White, Asian-Indian and Afro-Caribbean patients (n=4585) Adjusted for age, sex and ethnic group Error bars = 95% CI Adapted from Stratton IM, et al. BMJ 2000;321:405–412. 15
, whether randomised or not to treatment. Of these, 3642 were included in an analysis of relative risk to determine the relationship between exposure to glycaemia over time and the risk of macrovascular or microvascular complications.1. The incidence rates for any endpoint related to diabetes increased with each higher category of updated mean HbA1c.1. The increase in the incidence rate for microvascular endpoints was greater over the range of increasing glycaemia than was the increase in the incidence rate for myocardial infarction. Thus, at near normal concentrations of HbA1c, the risk of myocardial infarction was 2–3 times that of a microvascular endpoint, whereas in the highest category of HbA1c concentration the risks were of the same order.1. Stratton IM, et al. BMJ 2000;321:405– Updated mean HbA1c (%) Study population: White, Asian-Indian and Afro-Caribbean patients (n=4585) Adjusted for age, sex and ethnic group Error bars = 95% CI. Adapted from Stratton IM, et al. BMJ 2000;321:405–")
16
Thanks to an intensive early multifactorial therapy : an impressive trend to a decrease in mortality over time UKPDS 33 Conventionnal Deaths/year/100 patients UKPDS 33 Intensive ADVANCE Blood glucose standard 1.87 ADVANCE Blood Glucose Intensive ADVANCE, with more than patients, is the largest ever prospective study carried out in type 2 diabetes for the prevention of vascular disease. ACCORD Blood Glucose Intensif 1.79 ACCORD Blood Glucose standard 1.74 1.62 1.43 1.14

17
17 Quel est le bénèfice du contrôle glycémique sur la reduction des complications? 17

18
Pour prévenir les complications du diabète, il faut diminuer la glycémie
Il a été démontré dans de nombreuses études que le niveau glycémique moyen, évaluée par l’HbA1c, est corrélé au risque des complications 16 12 of Complications Relative Risk 8 4 Hemoglobin A1c 6 7 8 9 10 11 12 Valeur cible dans les recommandations : <7 % UKPDS 33: Lancet 1998; 352, DCCT Study Group. N Engl J Med 329:977, 1993

21
DCCT/EDIC: glycaemic control reduces risk of non-fatal MI, stroke or death from CVD in type 1 diabetes 21 9 Conventional treatment HbA1C (%) 8 Intensive treatment 7 Years 1 2 3 4 5 6 7 8 9 10 11 12 13 14 15 16 17 DCCT (intervention period)1 EDIC (observational follow-up)2 0.06 0.04 0.02 0.00 57% risk reduction* (p=0.02; 95% CI, 12 to 79%) Cumulative incidence: non-fatal MI, stroke or death from CVD Conventional treatment In DCCT (Diabetes Control and Complications Trial), 1441 patients with type 1 diabetes were randomised to intensive (3 daily insulin injections or insulin pump) or conventional treatment (1–2 daily insulin injections) for a mean follow-up period of 6.5 years. At the end of DCCT, participants receiving conventional treatment were offered intensive treatment. All patients returned to their own healthcare provider for diabetes care.1 In total, 1397 patients (96%) from the DCCT were followed in the observational EDIC (Epidemiology of Diabetes Interventions and Complications) study for a mean 17 years of follow-up.1 As shown in the upper graph, in DCCT the absolute difference in mean HbA1c between the intensive and conventional groups was ~2% (7.4% vs 9.1%; p<0.01) at 6.5 years, which was sustained during the intervention period. During EDIC, differences in HbA1c narrowed in these groups (8.0% vs 8.2%, respectively; p=0.03) at 11 years.1,2 As shown in the lower graph, changes in HbA1c associated with intensive treatment were accompanied by a reduction in risk of non-fatal myocardial infarction (MI), stroke or death. Differences between the conventional treatment group and the intensive treatment group started to appear from Year 9 onwards. The intensive treatment line stops at Year 17 as this was the time of the last recorded event.1 In EDIC, patients with type 1 diabetes who had received intensive treatment in DCCT had a 57% reduction in risk of non-fatal MI, stroke or death from cardiovascular disease (CVD) (95% CI, 12 to 79%; p=0.02). Intensive treatment also reduced the risk of any CVD event by 42% (95% CI, 9 to 63%; p=0.02).1 There are a number of potential mechanisms by which intensive glycaemic control may reduce CVD risk, including a reduction in HbA1c.1 DCCT/EDIC. N Engl J Med 2005;353:2643–2653. DCCT/EDIC. JAMA 2002;287:2563–2569. Intensive treatment Years DCCT (intervention period)3 EDIC (observational follow-up)3 *Intensive vs conventional treatment MI: myocardial infarction CVD: cardiovascular disease 1Adapted from DCCT. N Engl J Med 1993;329:977– DCCT/EDIC. JAMA 2002;287:2563– DCCT/EDIC. N Engl J Med 2005;353:2643–2653. 21
 8. Intensive treatment. 7. Years DCCT (intervention period)1 EDIC (observational follow-up) % risk reduction* (p=0.02; 95% CI, 12 to 79%) Cumulative incidence: non-fatal MI, stroke or death from CVD. Conventional treatment. In DCCT (Diabetes Control and Complications Trial), 1441 patients with type 1 diabetes were randomised to intensive (3 daily insulin injections or insulin pump) or conventional treatment (1–2 daily insulin injections) for a mean follow-up period of 6.5 years. At the end of DCCT, participants receiving conventional treatment were offered intensive treatment. All patients returned to their own healthcare provider for diabetes care.1. In total, 1397 patients (96%) from the DCCT were followed in the observational EDIC (Epidemiology of Diabetes Interventions and Complications) study for a mean 17 years of follow-up.1. As shown in the upper graph, in DCCT the absolute difference in mean HbA1c between the intensive and conventional groups was ~2% (7.4% vs 9.1%; p<0.01) at 6.5 years, which was sustained during the intervention period. During EDIC, differences in HbA1c narrowed in these groups (8.0% vs 8.2%, respectively; p=0.03) at 11 years.1,2. As shown in the lower graph, changes in HbA1c associated with intensive treatment were accompanied by a reduction in risk of non-fatal myocardial infarction (MI), stroke or death. Differences between the conventional treatment group and the intensive treatment group started to appear from Year 9 onwards. The intensive treatment line stops at Year 17 as this was the time of the last recorded event.1. In EDIC, patients with type 1 diabetes who had received intensive treatment in DCCT had a 57% reduction in risk of non-fatal MI, stroke or death from cardiovascular disease (CVD) (95% CI, 12 to 79%; p=0.02). Intensive treatment also reduced the risk of any CVD event by 42% (95% CI, 9 to 63%; p=0.02).1. There are a number of potential mechanisms by which intensive glycaemic control may reduce CVD risk, including a reduction in HbA1c.1. DCCT/EDIC. N Engl J Med 2005;353:2643–2653. DCCT/EDIC. JAMA 2002;287:2563–2569. Intensive treatment Years. DCCT (intervention period)3 EDIC (observational follow-up)3. *Intensive vs conventional treatment. MI: myocardial infarction. CVD: cardiovascular disease. 1Adapted from DCCT. N Engl J Med 1993;329:977–986. 2DCCT/EDIC. JAMA 2002;287:2563– DCCT/EDIC. N Engl J Med 2005;353:2643–")
22
Objectifs du traitement
Assurer le contrôle glycémique : contrôle de l’HbA1c en l’absence d’hypoglycémie sévère, à adapter en fonction de l’âge, de l’ancienneté du diabète, des situations particulières et du risque d’hypoglycémie. Contrôler les facteurs de risque associés. ALD 8 : diabète de type 2 : recommandations H.A.S. mai 2006

23
La stratégie recommandée du traitement hypoglycémiant depuis 2006
4 médicaments : metformine – sulfamides – glitazones - insulines 1 principe : éviter le retard à l’adaptation du traitement Prescrire rapidement la metformine Recourir largement et vite à la bithérapie Penser à la trithérapie orale Passer vite à l’insuline

24
Lorsque les cibles glycémiques ne sont pas atteintes:
Revue des stratégies thérapeutiques dans le DT2 : le moment de l’intervention est un facteur clé de succès Lorsque les cibles glycémiques ne sont pas atteintes: Changer le traitement pour passer à “l’étape” suivante Le changement du traitement actuel arrive souvent trop tard Une modification plus rapide du traitement est nécessaire It is time to revisit the traditional T2DM treatment strategy. A more aggressive treatment approach is required to prevent patients from being exposed to excessive hyperglycaemia for unnecessary periods of time. Brown J, et al. Diabetes Care 2004;27:1535―40. Brown J, et al. Diabetes Care 2004;27:1535―40.

25
Thérapie orientée vers la cible* Modification mode de vie
Revue des stratégies thérapeutiques du DTM2 7 9 HbA1c (%) 8 Diagnostic Thérapie orientée vers la cible* ETAPE 4 Basal plus prandial ETAPE 3 Insuline basale ETAPE 2 ADO associations ETAPE 1 ADO monothérapie Treatment for T2DM needs to be target driven and intensified as the disease progresses. The stepwise strategy, which begins with lifestyle modification followed by oral agents and then insulin therapy, is frequently applied at a slow pace with long delays between steps. Insulin treatment strategies should be used earlier to achieve and sustain HbA1c <7%. Riddle M. Endo Metab Clin NA 1997;26:659―77. Riddle M. Am J Med 2004;116:35―95. Modification mode de vie Adapted from Riddle M. Endo Metab Clin NA 1997;26:659―77. Riddle M. Am J Med 2004;116:35―95. *Individualisé
 8. Diagnostic. Thérapie orientée vers la cible* ETAPE 4. Basal plus prandial. ETAPE 3. Insuline basale. ETAPE 2. ADO associations. ETAPE 1. ADO monothérapie. Treatment for T2DM needs to be target driven and intensified as the disease progresses. The stepwise strategy, which begins with lifestyle modification followed by oral agents and then insulin therapy, is frequently applied at a slow pace with long delays between steps. Insulin treatment strategies should be used earlier to achieve and sustain HbA1c <7%. Riddle M. Endo Metab Clin NA 1997;26:659―77. Riddle M. Am J Med 2004;116:35―95. Modification mode de vie. Adapted from Riddle M. Endo Metab Clin NA 1997;26:659―77. Riddle M. Am J Med 2004;116:35―95. *Individualisé.")
26
Ce qu’il faut éviter : « l’inertie clinique »
These results strongly suggest that the recommended threshold for action should be lower than 7%. HbA1C 7 Diet Monotherapy Dual therapy Triple therapy Insulin early Ce qu’il faut éviter : « l’inertie clinique »

27
Médicaments hypoglycémiants : une offre en rapide expansion
Les insulines Metformine Sulfamides Glitazones Glinides (Novonorm) Acarbose GLP1-agonistes (Byetta…) DPP4-inhibiteurs (Januvia…) figurent dans l’algorithme des recos actuelles ne figurent pas dans l’algorithme des recos actuelles Les nouveaux antidiabétiques
 Acarbose. GLP1-agonistes (Byetta…) DPP4-inhibiteurs (Januvia…) figurent dans l’algorithme des recos actuelles. ne figurent pas dans l’algorithme des recos actuelles. Les nouveaux antidiabétiques.")
28
Les objectifs glycémiques clés de l’autosurveillance sont
Entre 0,80 et 1,2 g/l à jeun Entre 0,70 et 1,30 g/l vers 17h avant dîner 28

29
Fréquence et horaire des auto-contrôles
La fréquence optimale et l’horaire des auto-contrôles de surveillance dans le diabète de type 2 ne sont pas à ce jour établis mais ils doivent être suffisants pour permettre d’atteindre les objectifs glycémiques fixés. Recommandations de L’ADA. Diabetes Care 2003; 26, suppl. 1. 29

30
Fréquence et horaire des auto-contrôles / propositions
Sous ADO ASG à jeun et avant le dîner 2 à 3 fois par semaine Les glycémies post prandiales (2h après le début d’un repas) peuvent être intéressantes En cas de discordance entre l’HbA1c et les glycémies pré-prandiales : HbA1c >7% et glycémies pré-prandiales comprises entre 0,7 et 1,30 g/l A titre éducatif : pour évaluer le caractère plus ou moins hyperglycémiant de tel ou tel aliment Sous traitement combiné ADO + insuline ASG quotidienne le matin, pour adapter les doses d’insuline et avant le dîner, pour adapter les doses d’ADO, en particulier des sulfamides hypoglycémiants 30
 peuvent être intéressantes. En cas de discordance entre l’HbA1c et les glycémies pré-prandiales : HbA1c >7% et glycémies pré-prandiales comprises entre 0,7 et 1,30 g/l. A titre éducatif : pour évaluer le caractère plus ou moins hyperglycémiant de tel ou tel aliment. Sous traitement combiné ADO + insuline. ASG quotidienne le matin, pour adapter les doses d’insuline et avant le dîner, pour adapter les doses d’ADO, en particulier des sulfamides hypoglycémiants. 30.")
31
Intérêt de l’auto-surveillance glycémique
Sensibiliser le patient à l’intérêt de la diététique et de l’exercice physique régulier Déterminer la posologie d’un sulfamide en début ou lors d’un changement de traitement Contrôler l’équilibre glycémique en cas de maladie intercurrente ou de prescription d’une médication diabétogène L’auto-surveillance glycémique régulière est nécessaire chez le diabétique de type 2 traité par l’insuline Recommandations de l’ANAES. Sept Diabetes Metab 2000; 26, suppl. 5. 31

32
*Insulin, sulphonylureas, metformin
Limitations of Monotherapy* UKPDS Patients at HbA1C <7.0% At 3 years At 6 years At 9 years Yes 45% 30% 15% No 55% 70% 85% The landmark UKPDS study has shown that monotherapy has serious limitations in maintaining HbA1C values at less than 7%. In this prospective study, the percentage of patients achieving HbA1C of 7% or less was 45% (3 years), 30% (6 years), 15% (9 years). UKPDS concluded that therapies need to be combined to deliver a target-driven treatment approach. *Insulin, sulphonylureas, metformin UKPDS 49. JAMA 1999;281:2005–2012
, 30% (6 years), 15% (9 years). UKPDS concluded that therapies need to be combined to deliver a target-driven treatment approach. *Insulin, sulphonylureas, metformin. UKPDS 49. JAMA 1999;281:2005–2012.")
33
Treatment monotherapy failure in the UKPDS
UKPDS : HbA1c deteriorates over time UKPDS : Number of patients treated to target HbA1c < 7% rapidly decline The currently available oral antidiabetic agents, when used as monotherapy, are unable to consistently achieve or maintain long-term euglycaemia

36
1° étape : metformine titrée sur la tolérance
On commence à 500 mg/jour, Puis on augmente progressivement sur les 2 premiers mois, fonction de la tolérance digestive, Jusqu’à la dose maximale efficace ( mg X 2) Au-delà de 1.5 à 2 g/jour, peu de bénéfices glycémiques (pour plus d’effets secondaires) The American Journal of Medicine
 Au-delà de 1.5 à 2 g/jour, peu de bénéfices glycémiques (pour plus d’effets secondaires) The American Journal of Medicine")
37
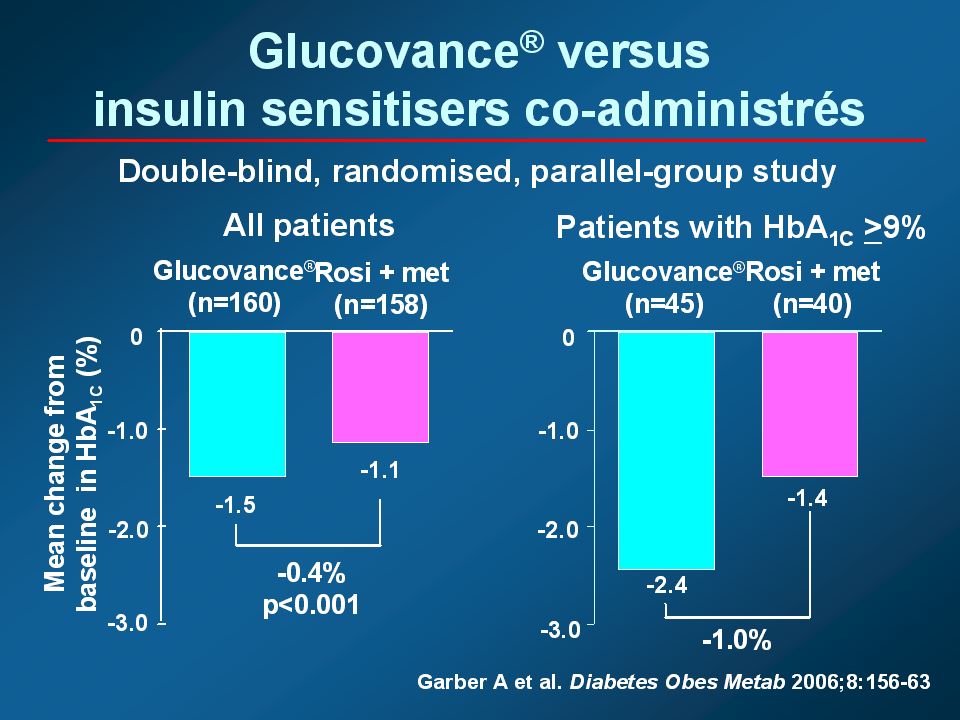
Choice of Combination Therapies
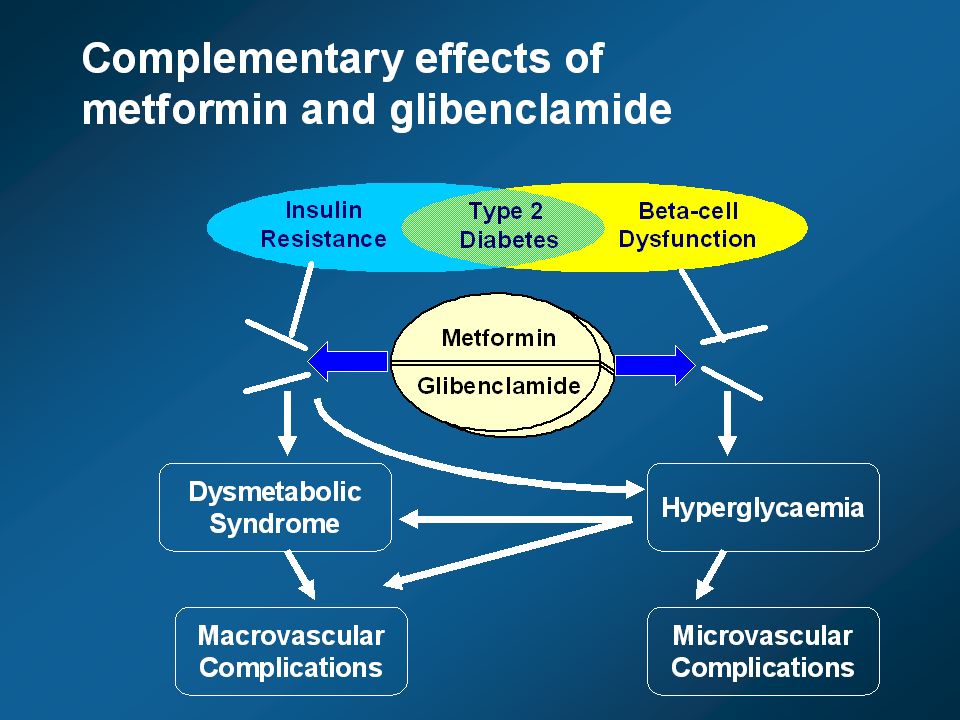
Metformin + Sulphonylurea1 Metformin + TZD Metformin + AGI Metformin + Gliptin Sulphonylurea + TZD TZDs + AGI Insulin Resistance β-cell Deficiency Combination therapy and the dual endocrine deficit of type 2 diabetes Co-administration of metformin and a sulphonylurea target insulin resistance and -cell deficiency, respectively, which are the principal endocrine defects present in most patients with type 2 diabetes. This is not the case with combinations of metformin or a sulphonylurea with an -glucosidase inhibitor, or metformin combined with a thiazolidinedione. Metformin and glibenclamide are therefore an ideal combination of agents for inclusion within the Glucovance® tablet. 1Sulphonylurea or meglitinide TZD: thiazolidinedione, AGI: -glucosidase inhibitor

40
La présentation galénique particulière
de Glucovance® Différentes tailles de particules de glibenclamide dans une matrice de metformine soluble Présentation galénique Au sein de l'association sous forme de comprimé pelliculé, la présentation galénique du glibenclamide est particulière, consistant en un spectre de particules de différentes tailles contrôlées (25 % sont ≤ 6 µm, 50 % sont ≤ 7-10 µm, 75% sont ≤ 21 µm et 25 % sont > 21 µm) dans une matrice de metformine soluble. Cette formulation sophistiquée semble permettre une libération plus rapide de glibenclamide après l’administration de Glucovance®. 6 µm 7-10 µm 21 µm > 21 µm 25% 50% 75%
 dans une matrice de metformine soluble. Cette formulation sophistiquée semble permettre une libération plus rapide de glibenclamide après l’administration de Glucovance®. 6 µm. 7-10 µm. 21 µm. > 21 µm. 25% 50% 75%")
41
Plasma Glibenclamide (µg/L)
Résultats pharmacocinétiques Avec Glucovance® : une absorption précoce du glibenclamide en comparaison à la co-administration de metformine + glibenclamide une concentration plasmatique biphasique (2 pics) 80 60 Plasma Glibenclamide (µg/L) 40 Résultats pharmacocinétiques Une absorption plus rapide du glibenclamide avec Glucovance® était objectivée par l’aire sous la courbe de 0 à 3 heures (AUC3) 2 fois plus élevée et de façon statistiquement significative (p <0,001) au 14e jour, donc se maintenant après administration chronique, et elle était observée dès le 1e jour. Le tmax de 4,5 heures sous Glucovance® (le temps auquel on observe la concentration maximale de produit dans le sang) était plus court de 1,5 heures que le tmax de la co-administration metformine + glibenclamide. Les 2 courbes de concentration plasmatique du glibenclamide avaient des formes très différentes : la courbe observée avec Glucovance® était biphasique avec un pic précoce à 2,5 heures et un second pic à 4,5 heures, alors que la courbe observée avec la co-administration de metformine + glibenclamide avait seulement un pic tardif à 6-7 heures. En revanche l’exposition globalte (AUCt) était équivalente pour les 2 types de traitement. Le pic précoce observé sous Glucovance® coïncidait avec la période post-prandiale précoce et rendait compte de l’exposition précoce bien plus importante sous Glucovance® reflétée par un AUC3 élevé. La formulation galénique particulière de Glucovance® explique ce profil pharmacocinétique : les plus petites particules de glibenclamides contribuant au pic précoce, les plus grosses au pic tardif. Metformin + free glibenclamide co-administered 20 Metformin/glibenclamide combination (Glucovance®) 2 4 6 8 10 12 Time after Dosing (h)
 Plasma Glibenclamide (µg/L) 40. Résultats pharmacocinétiques. Une absorption plus rapide du glibenclamide avec Glucovance® était objectivée par l’aire sous la courbe de 0 à 3 heures (AUC3) 2 fois plus élevée et de façon statistiquement significative (p <0,001) au 14e jour, donc se maintenant après administration chronique, et elle était observée dès le 1e jour. Le tmax de 4,5 heures sous Glucovance® (le temps auquel on observe la concentration maximale de produit dans le sang) était plus court de 1,5 heures que le tmax de la co-administration metformine + glibenclamide. Les 2 courbes de concentration plasmatique du glibenclamide avaient des formes très différentes : la courbe observée avec Glucovance® était biphasique avec un pic précoce à 2,5 heures et un second pic à 4,5 heures, alors que la courbe observée avec la co-administration de metformine + glibenclamide avait seulement un pic tardif à 6-7 heures. En revanche l’exposition globalte (AUCt) était équivalente pour les 2 types de traitement. Le pic précoce observé sous Glucovance® coïncidait avec la période post-prandiale précoce et rendait compte de l’exposition précoce bien plus importante sous Glucovance® reflétée par un AUC3 élevé. La formulation galénique particulière de Glucovance® explique ce profil pharmacocinétique : les plus petites particules de glibenclamides contribuant au pic précoce, les plus grosses au pic tardif. Metformin + free glibenclamide. co-administered. 20. Metformin/glibenclamide. combination (Glucovance®) Time after Dosing (h)")
44
Statistiquement significatif versus monothérapies
Résultats Proportion de patients atteignant les objectifs cibles d’HbA1c (HbA1c finale < 7%) Statistiquement significatif versus monothérapies 10 20 30 40 50 60 70 80 75,5 % de patients 63,8 41,9 37,6 Résultats sur l’HbA1c En fin d'étude, sous association fixe 75,5 % des patients dans le groupe Glucovance® 500 mg/2,5 mg 63,8 % dans le groupe Glucovance® 500 mg/5 mg avaient atteint un objectif d'HbA1c < 7 %. En revanche, sous monothérapie : 41,9 % des patients dans le groupe glibenclamide 37,6 % des patients dans le groupe metformine Ainsi, sous Glucovance®, le nombre de patients ayant atteint l’objectif thérapeutique était augmenté de 75 %. GLIBENCLAMIDE METFORMINE 500/2,5 500/5 Pour augmenter de 75% le nombre de patients atteignant l’objectif thérapeutique
 Statistiquement significatif versus monothérapies ,5. % de patients. 63,8. 41,9. 37,6. Résultats sur l’HbA1c. En fin d étude, sous association fixe. 75,5 % des patients dans le groupe Glucovance® 500 mg/2,5 mg. 63,8 % dans le groupe Glucovance® 500 mg/5 mg. avaient atteint un objectif d HbA1c < 7 %. En revanche, sous monothérapie : 41,9 % des patients dans le groupe glibenclamide. 37,6 % des patients dans le groupe metformine. Ainsi, sous Glucovance®, le nombre de patients ayant atteint l’objectif thérapeutique était augmenté de 75 %. GLIBENCLAMIDE. METFORMINE. 500/2,5. 500/5. Pour augmenter de 75% le nombre de patients atteignant l’objectif thérapeutique.")
45
Résultats Variations de la glycémie à jeun à 16 semaines (4 mois)
GLIBENCLAMIDE METFORMINE 500/2,5 500/5 - 0,5 - 0,45 - 0,4 - 0,35 - 0,3 - 0,25 - 0,2 - 0,15 - 0,1 - 0,05 - 0,13 - 0,10 - 0,42 - 0,47 Variation de la GAJ (%) Statistiquement significatif versus monothérapies (p < 0,001) Résultats sur la glycémie à jeun Après 16 semaines de traitement (4 mois), la réduction de la glycémie à jeun (GAJ) par rapport à la valeur initiale était de 0,47 % dans le groupe Glucovance® 500 mg/2,5 mg 0,42 % dans le groupe Glucovance® 500 mg/5 mg sans différence significative entre les deux groupes. En revanche, la réduction de la glycémie à jeun par rapport à la valeur initiale était statistiquement significative dans les groupes Glucovance® versus monothérapies (p < 0,001) : 0,13 % dans le groupe glibenclamide 0,10 % dans le groupe metformine. Une réduction de la glycémie à jeun significativement supérieure
 Statistiquement significatif versus monothérapies (p < 0,001) Résultats sur la glycémie à jeun. Après 16 semaines de traitement (4 mois), la réduction de la glycémie à jeun (GAJ) par rapport à la valeur initiale était de. 0,47 % dans le groupe Glucovance® 500 mg/2,5 mg. 0,42 % dans le groupe Glucovance® 500 mg/5 mg. sans différence significative entre les deux groupes. En revanche, la réduction de la glycémie à jeun par rapport à la valeur initiale était statistiquement significative dans les groupes Glucovance® versus monothérapies (p < 0,001) : 0,13 % dans le groupe glibenclamide. 0,10 % dans le groupe metformine. Une réduction de la glycémie à jeun significativement supérieure.")
46
Troubles gastro- intestinaux (n)
Aucun cas grave d’hypoglycémie GLIBENCLAMIDE METFORMINE 500/2,5 500/5 n 103 104 101 Hypoglycémies (n) 8 1 11 14 Troubles gastro- intestinaux (n) 12 15 7 19 Effets indésirables : aucun cas grave d’hypoglycémie Glucovance® a été bien toléré dans les 2 groupes de traitement. Il n’y avait pas de différence sur l’incidence des effets indésirables entre Glucovance® et monothérapies. La fréquence des hypoglycémies était un peu plus élevée sous Glucovance® que sous sulfamide seul. Il n’y a eu aucun cas grave d’hypoglycémie, et seulement 2 arrêts de traitement pour hypoglycémie.
 Troubles gastro- intestinaux (n) Effets indésirables : aucun cas grave d’hypoglycémie. Glucovance® a été bien toléré dans les 2 groupes de traitement. Il n’y avait pas de différence sur l’incidence des effets indésirables entre Glucovance® et monothérapies. La fréquence des hypoglycémies était un peu plus élevée sous Glucovance® que sous sulfamide seul. Il n’y a eu aucun cas grave d’hypoglycémie, et seulement 2 arrêts de traitement pour hypoglycémie.")
47
Résultats Variation de l’HbA1c (%) à 16 semaines (4 mois) 0,31 - 0,02
GLIBENCLAMIDE METFORMINE 500/2,5 500/5 0,31 0,7 Variation d'HbA1c (%) - 0,1 - 0,02 - 1,51 - 1,53 - 0,9 -1,7 Statistiquement significatif versus monothérapies (p < 0,001) Résultats sur l’HbA1c Après 16 semaines de traitement, la réduction d'HbA1c par rapport à la valeur initiale était de : 1,51 % dans le groupe Glucovance® 500 mg/2,5 mg 1,53 % dans le groupe Glucovance® 500 mg/5 mg sans différence significative entre les deux groupes. En revanche, la réduction d'HbA1c par rapport à la valeur initiale était statistiquement significative sous Glucovance® versus monothérapies (p < 0,001) : réduction de 0,02 % dans le groupe glibenclamide augmentation de 0,31 % dans le groupe metformine Un gain d’efficacité significatif sur l’HbA1c
 - 0,1. - 0, , , ,9. -1,7. Statistiquement significatif versus monothérapies. (p < 0,001) Résultats sur l’HbA1c. Après 16 semaines de traitement, la réduction d HbA1c par rapport à la valeur initiale était de : 1,51 % dans le groupe Glucovance® 500 mg/2,5 mg. 1,53 % dans le groupe Glucovance® 500 mg/5 mg. sans différence significative entre les deux groupes. En revanche, la réduction d HbA1c par rapport à la valeur initiale était statistiquement significative sous Glucovance® versus monothérapies (p < 0,001) : réduction de 0,02 % dans le groupe glibenclamide. augmentation de 0,31 % dans le groupe metformine. Un gain d’efficacité significatif sur l’HbA1c.")
48
Statistiquement significatif versus monothérapies
Pour atteindre l'objectif thérapeutique chez 8 fois plus de patients Proportion de patients atteignant les objectifs ciblés d’HbA1c à 16 semaines (HbA1c < 7%) 5 10 15 20 25 30 X 8 % de patients 24,7 22,6 2,5 2,8 Résultats sur l’HbA1c En fin d'étude, sous Glucovance® : 24,7 % des patients dans le groupe Glucovance® 500 mg/2,5 mg 22,6 % dans le groupe Glucovance® 500 mg/5 mg avaient atteint un objectif d'HbA1c < 7 %. En revanche, sous monothérapie : 2,5 % des patients dans le groupe glibenclamide 2,8 % des patients dans le groupe metformine Ainsi, sous association fixe, l’objectif thérapeutique était atteint chez 8 fois plus de patients. GLIBENCLAMIDE METFORMINE 500/2,5 500/5 Statistiquement significatif versus monothérapies
 X 8. % de patients. 24,7. 22,6. 2,5. 2,8. Résultats sur l’HbA1c. En fin d étude, sous Glucovance® : 24,7 % des patients dans le groupe Glucovance® 500 mg/2,5 mg. 22,6 % dans le groupe Glucovance® 500 mg/5 mg. avaient atteint un objectif d HbA1c < 7 %. En revanche, sous monothérapie : 2,5 % des patients dans le groupe glibenclamide. 2,8 % des patients dans le groupe metformine. Ainsi, sous association fixe, l’objectif thérapeutique était atteint chez 8 fois plus de patients. GLIBENCLAMIDE. METFORMINE. 500/2,5. 500/5. Statistiquement significatif versus monothérapies.")
57
Initier le traitement 1 à 4 comprimés à 500 / 5
Présentation: comprimés pelliculés dosées à 500 mg de metformine / 2,5 mg de Glibenclamide ou 500 mg / 5 mg Commencer par de faibles doses et augmenter progressivement selon les besoins de l’efficacité et la tolérance Patients non contrôlés sous Metformine en monothérapie: 1 à 4 comprimés à 500 / 2,5 Patients non contrôlés sous sulfamides en monothérapie: 1 à 4 comprimés à 500 / 5 Remplacement d’une association libre de metformine et sulfamide : 1 à 4 comprimé à 500 / 5 Respecter les contre indications: identiques à celles de la metformine et des sulfamides

58
Optimiser le traitement
Ajuster la posologie par paliers progressifs de 2 semaines Dose maximum: 4 à 6 cp / j ( Glibenclamide max: 2 g/j, Metformine max: 2 g /j ) Pouvant être fractionnés en 2 à 3 prises au cours des repas Efficacité jugée sur le niveau des glycémies à jeûn et post prandiales et le dosage de l’ Hb A1C
 Pouvant être fractionnés en 2 à 3 prises au cours des repas. Efficacité jugée sur le niveau des glycémies à jeûn et post prandiales et le dosage de l’ Hb A1C.")
59
Conclusions L’atteinte des objectifs à long terme nécessite des combinaisons ( bi ou trithérapies ) L’association Metformine et Glibenclamide s’appuie sur un niveau de preuve probant Glucovance® est le fruit d’une innovation galénique procurant: meilleure efficacité clinique atteinte des valeurs cibles avec moindre exposition à chacun des composants différents dosages permettant une individualisation de laposologie bonne tolérance meilleure compliance

60
Médicaments hypoglycémiants
Que disent les recommandations Diagnostic étape 1 Metformine pour tout le monde* *si régime/activité physique insuffisants HbA1c % étape 2 Les options de la bithérapie orale Choisir un traitement combiné à la metformine

61
Les options de la bithérapie orale en 2008
Diagnostic étape 1 Régime/activité physique/metformine étape 2 HbA1c 6.5-7% Ajouter sulfamide Ajouter glitazone ADO « classiques » ceux des recos 2006

62
Les options de la bithérapie orale en 2008
Diagnostic étape 1 Régime/activité physique/metformine étape 2 HbA1c 6.5-7% Ajouter DPP4-inhibiteur Ajouter sulfamide Ajouter glitazone ADO « classiques »

63
Les options de la bithérapie orale en 2008
Diagnostic Régime/activité physique + metformine si échec étape 1 étape 2 HbA1c 6.5-7% Plutôt si phénotype d’insulino-résistance Ajouter glitazone Bonne durabilité mais prise de poids Ajouter un insulino-sécrétagogue Insuline Pancreas

65
OAD + multiple daily insulin injections
The case for early combination therapy: reaching and maintaining glycaemic goals 65 OAD + multiple daily insulin injections Diet and exercise OAD + basal insulin 10 OAD uptitration OAD monotherapy 9 HbA1c(%)1 OAD combination 8 7 Mean 6 Duration of diabetes An early, intensive approach to type 2 diabetes management reduces the mean HbA1c and reduces the risk of early treatment failure by adopting an intensive therapeutic strategy immediately upon diagnosis.1 When diet and exercise fail to achieve glycaemic targets, early use of combination therapy with oral anti-diabetics provides better and more rapid glycaemic control than the stepwise approach, and therefore can reduce the risk of complications.1 Del Prato S, et al. Int J Clin Pract 2005;59:1345–1355. Complications2 1Adapted from Del Prato S, et al. Int J Clin Pract 2005;59:1345– Stratton IM, et al. BMJ 2000;321:405–412. OAD = oral anti-diabetic 65
1. OAD. combination Mean. 6. Duration of diabetes. An early, intensive approach to type 2 diabetes management reduces the mean HbA1c and reduces the risk of early treatment failure by adopting an intensive therapeutic strategy immediately upon diagnosis.1. When diet and exercise fail to achieve glycaemic targets, early use of combination therapy with oral anti-diabetics provides better and more rapid glycaemic control than the stepwise approach, and therefore can reduce the risk of complications.1. Del Prato S, et al. Int J Clin Pract 2005;59:1345–1355. Complications2. 1Adapted from Del Prato S, et al. Int J Clin Pract 2005;59:1345– Stratton IM, et al. BMJ 2000;321:405–412. OAD = oral anti-diabetic. 65.")
66
Conclusions and implications for patient care
66 Conclusions Le control glycemic reduces the risk of diabetes complications, particularly microvascular complications Early glycaemic control is associated with a long-lasting ‘legacy’ effect in reducing later complications Implications for patient care Early intervention to achieve and maintain glycaemic targets is critical Treatment should be individualised over time to maintain an optimal balance between the benefits and risks of an intensive glucose control strategy Maintain HbA1c as close to normal as safely possible Consider early combination therapy Based on the outcomes of long-term glycaemic intervention studies, it can be concluded that: Glycaemic control significantly reduces the risk of diabetes complications, particularly microvascular complications. Consistent with the key UKPDS1,2 findings, recent trials including ADVANCE3 and VADT4 have reinforced the value of glycaemic intervention in reducing microvascular complications, particularly nephropathy-related complications. Early glycaemic control is associated with a long-lasting ‘legacy’ effect in reducing later complications. The UKPDS post-trial monitoring study showed that glycaemic control in newly diagnosed type 2 diabetes patients was associated with significant reductions in the relative risk of diabetes complications, including microvascular disease, myocardial infarction, and all-cause mortality, up to 10 years following the cessation of randomised interventions.2 The conclusions highlight several key implications for patient care in type 2 diabetes: Early intervention to achieve and maintain glycaemic targets is critical. Evidence of a legacy effect of intensive glycaemic control in the UKPDS study indicates that early glycaemic control has an enduring effect in reducing the risk of later complications; conversely, poor glycaemic control may lead to an enduring increased risk of complications. Treatment should be individualised over time to maintain an optimal balance between the benefits and risks of an intensive glucose control strategy: Maintain HbA1c as close to normal as safely possible Consider early combination therapy Recent glycaemic intervention trials using different intensive glucose control protocols have yielded somewhat different results. For example, whereas intensive glucose control in the ACCORD5 study was associated with increased mortality, no increased risk was observed in ADVANCE, VADT or UKPDS. Since the benefits and risks of intensive glucose control may depend on characteristics of the patient and therapy used, it is important to individualise treatment to achieve an optimal benefit:risk profile for each patient Early combination therapy should be considered as one strategy for avoiding periods of uncontrolled hyperglycaemia and increasing the proportion of patients who maintain target HbA1c Stratton IM, et al. BMJ 2000;321:405–412. Holman R, et al. N Engl J Med 2008;359:1577–1589. ADVANCE Collaborative Group. N Engl J Med 2008;358:2560–2572. Duckworth W, et al. N Engl J Med 2009;360:129–139. ACCORD Study Group. N Engl J Med 2008;358:2545–2559. 66

67
67 Steno-2: benefits of a multifactorial approach in reducing CV events and mortality over 13 years Active trial Post-trial follow-up 80 70 HR 0.41 (p<0.001, 95% CI, 0.25 to 0.67) at 13.3 years 60 Cumulative incidence of any CV event (%) 50 Conventional therapy 40 30 Intensive therapy 20 In the Steno-2 study, patients with type 2 diabetes and microalbuminuria (n=160) were randomised to conventional treatment, based on national guidelines, or intensive treatment: reduced-fat diet, regular exercise, smoking-cessation counselling, vitamin supplementation, aspirin, stepwise antiglycaemic medication, angiotensin-converting enzyme inhibitor or angiotensin II-receptor blocker (all patients), additional stepwise antihypertension intervention (hypertensive patients) and lipid-modifying therapy (with statin and/or fibrate).1 The mean treatment period was 7.8 years. Patients were then followed for a mean observational period of 5.5 years (for a total of 13.3 years) during which, structured treatment in the intensive group stopped and all patients were informed of the benefits of intensive, multifactorial treatment.1,2 At 7.8 years, intensive intervention was associated with a significantly lower risk of cardiovascular disease (CVD) than conventional treatment (hazard ratio 0.47, 95% CI, 0.24 to 0.73; p=0.008)1 and was sustained at 13.3 years (hazard ratio 0.41, 95% CI, 0.25 to 0.67; p<0.001).2 A CVD event could include death from CV causes, non-fatal stroke, non-fatal myocardial infarction, coronary-artery bypass grafting, percutaneous coronary intervention or revascularisation for peripheral atherosclerotic artery disease and amputation due to ischaemia.1,2 Gæde P, et al. N Engl J Med 2003;348:383–393. Gæde P, et al. N Engl J Med 2008;358:580–591. 10 1 2 3 4 5 6 7 8 9 10 11 12 13 Years CV: cardiovascular HR: hazard ratio Adapted from Gæde P, et al. N Engl J Med 2008;358:580–591. 67
 at 13.3 years. 60. Cumulative incidence of any CV event (%) 50. Conventional therapy Intensive therapy. 20. In the Steno-2 study, patients with type 2 diabetes and microalbuminuria (n=160) were randomised to conventional treatment, based on national guidelines, or intensive treatment: reduced-fat diet, regular exercise, smoking-cessation counselling, vitamin supplementation, aspirin, stepwise antiglycaemic medication, angiotensin-converting enzyme inhibitor or angiotensin II-receptor blocker (all patients), additional stepwise antihypertension intervention (hypertensive patients) and lipid-modifying therapy (with statin and/or fibrate).1. The mean treatment period was 7.8 years. Patients were then followed for a mean observational period of 5.5 years (for a total of 13.3 years) during which, structured treatment in the intensive group stopped and all patients were informed of the benefits of intensive, multifactorial treatment.1,2. At 7.8 years, intensive intervention was associated with a significantly lower risk of cardiovascular disease (CVD) than conventional treatment (hazard ratio 0.47, 95% CI, 0.24 to 0.73; p=0.008)1 and was sustained at 13.3 years (hazard ratio 0.41, 95% CI, 0.25 to 0.67; p<0.001).2 A CVD event could include death from CV causes, non-fatal stroke, non-fatal myocardial infarction, coronary-artery bypass grafting, percutaneous coronary intervention or revascularisation for peripheral atherosclerotic artery disease and amputation due to ischaemia.1,2. Gæde P, et al. N Engl J Med 2003;348:383–393. Gæde P, et al. N Engl J Med 2008;358:580– Years. CV: cardiovascular. HR: hazard ratio. Adapted from Gæde P, et al. N Engl J Med 2008;358:580–")
Présentations similaires


 and associated factors in HIV-infected patients,>")


 1 re présentation UKPDS : Barcelone 1998 –Surmortalité observée dans le groupe sulfamides (SU)>")


